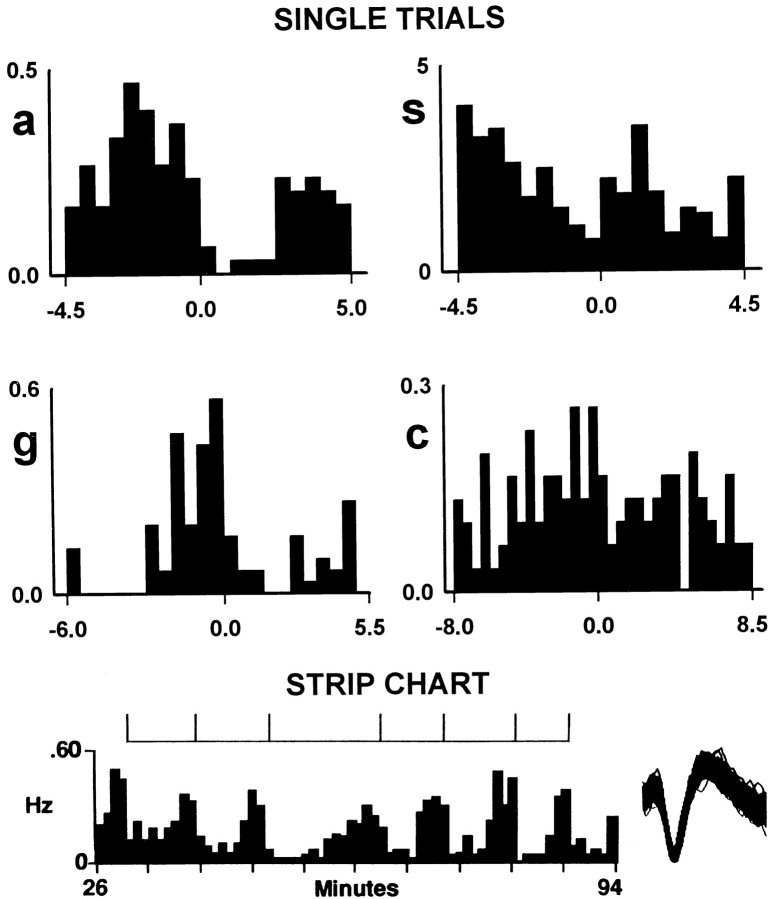
Fig. 8.
Progressive reversals in firing rate exhibited by individual neurons on individual trials. Each of the four lever-press histograms was constructed for a neuron already illustrated in Figure7; the letter at the left of each histogram indicates the corresponding histogram in Figure 7. The time base of each histogram equals the pre- and postpress interinfusion interval for that trial. Bin width equals 0.5 min. The strip chart (bottom) displays repeated progressive reversals exhibited by a single neuron across successive lever presses. The corresponding lever presses are demarcated as ticks on the barat the top of the strip chart. To the right is a sample of waveforms for the neuron (not shown in other figures) depicted in the strip chart.

