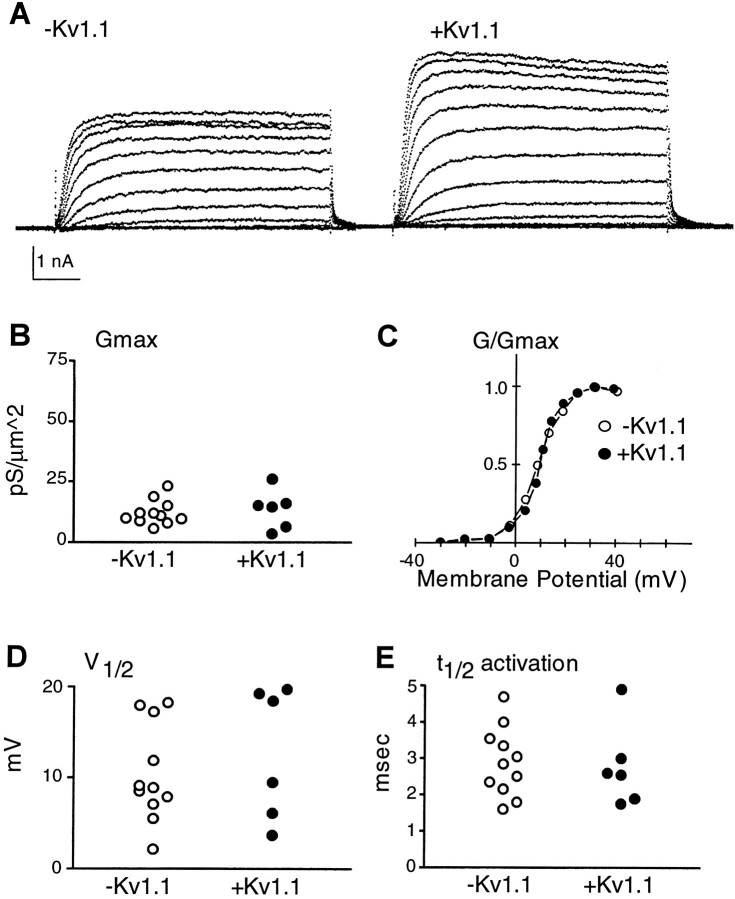
Fig. 5.
Comparison of biophysical and molecular profiles of individual mature neurons. A, Potassium currents from neurons that either do not (left) or do (right) express Kv1.1 mRNA. Calibration: 5 msec. B, Neurons that are + or −Kv1.1 have maximal conductance density (Gmax) within the same range; average values are (in pS/μ2) −Kv1.1, 12.2 ± 1.5, n = 11; +Kv1.1, 13.6 ± 3.2, n = 6. C, Normalized conductances (G/Gmax) plotted versus membrane potential for the currents recorded from two neurons shown in A are not different. D, Neurons that are + or −Kv1.1 exhibit V1/2 within the same range; average values are (in mV): −Kv1.1, 10.4 ± 1.6, n = 11; +Kv1.1, 12.8 ± 2.9, n = 6. E, Neurons that are + or −Kv1.1 have t1/2 within the same range; average values for t1/2 at 30 mV are (in msec): −Kv1.1, 2.9 ± 0.3, n = 11; +Kv1.1, 2.8 ± 0.5, n = 6.

