
Fig. 4.
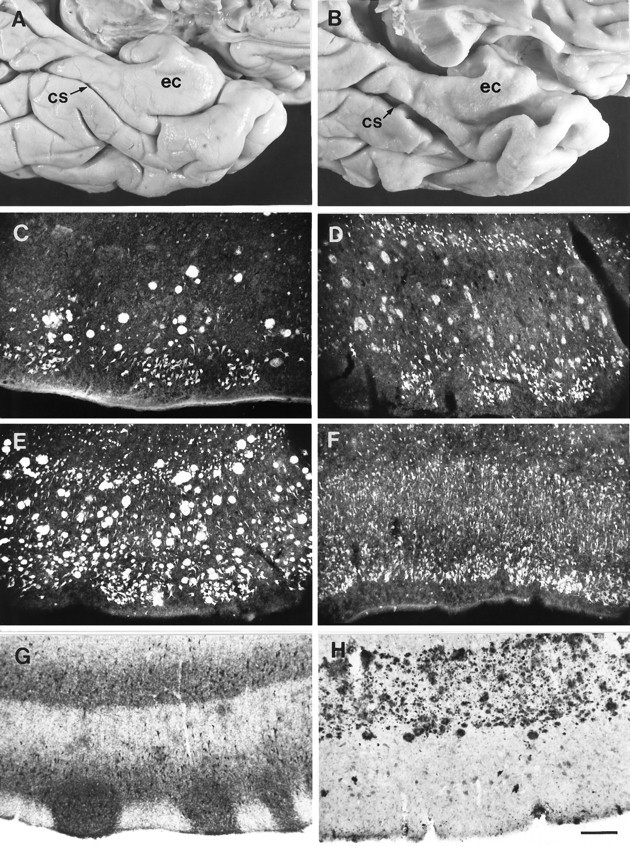
Neuropathological markers on the entorhinal cortex of AD cases. A, Gross view of the ventromedial temporal cortex of a control subject. ec, Entorhinal cortex;cs, collateral sulcus. B, Same view as inA taken from an AD patient. Note the atrophic appearance of the entorhinal cortex. C–F, Thioflavine-S histochemical staining depicting the distribution of NFTs and NPs at pathology grades 1–4, respectively. G, Example of brain Tau isoforms immunostaining (epitope to N-terminal residues 2–10; Goedert et al., 1991) with the Alz-50 antibody showing the location of NFTs.H, Amyloid precursor protein (APP) distribution as seen with antibody 10D5, depicting a dense band of plaques in layer IIIb. Scale bar, 200 μm.