
Fig. 6.
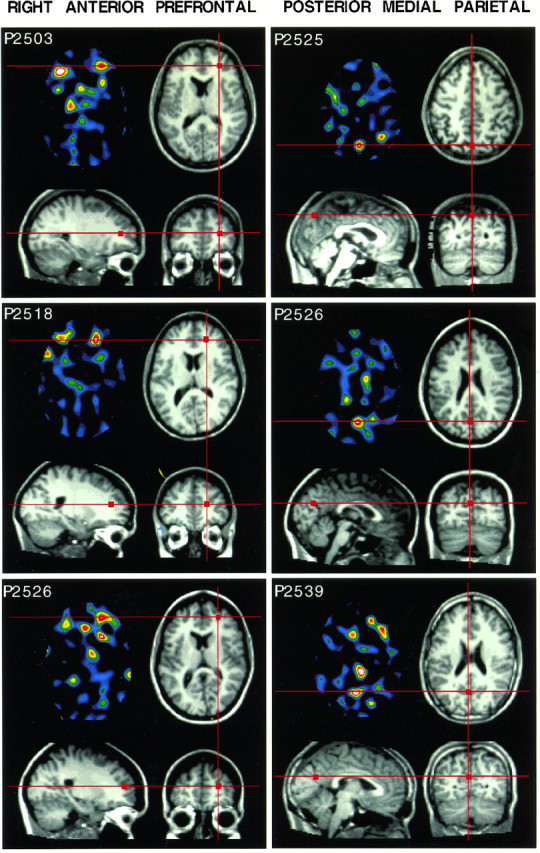
Within-subject PET activation data are shown coregistered with structural MRI data. Three single subject activations for each of two areas are shown (see Results). The color sections are transverse PET images with raw subtracted PET data from each subject. Images are scaled near the slice maximum. Three separate MRI views of each subject are aligned to center on the peak activation identified in the PET image (see Materials and Methods).Red lines and square markings show corresponding locations across the different modality types and views.