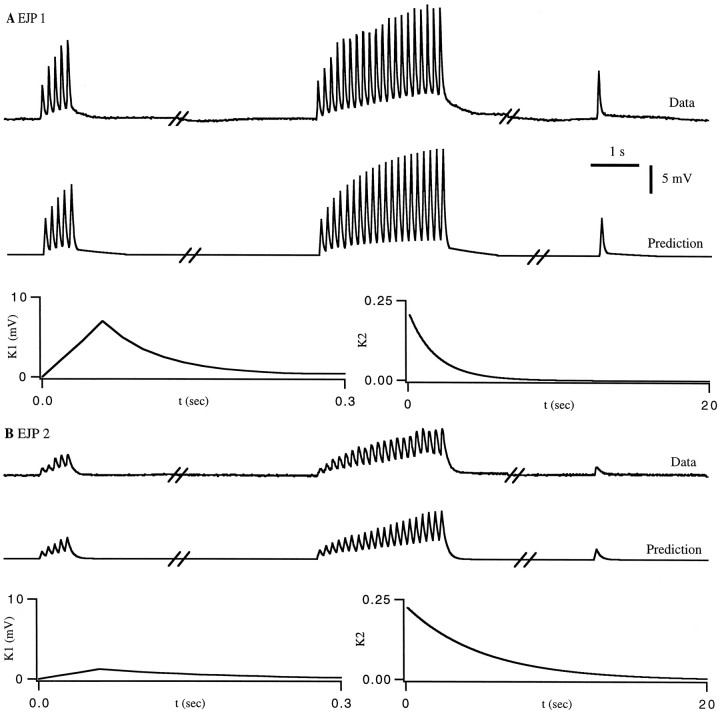
Fig. 10.
Comparison of two synapses. The breaks in the traces represent time intervals of 20 sec and then 10 sec. In both cases, the functions used for the prediction are shownunderneath the two EJP traces. Nonlinear functionsF similar to those shown in previous figures were used here but are not plotted. A, Comparison of the measured and predicted responses of a cpv4 muscle to a test spike train. The baseline membrane potential was −56 mV. Over the entire data set, the r.m.s. error in the prediction of the peak EJP amplitude was 0.7 mV (5% relative error). B, Comparison of the measured and predicted responses of a gm6 muscle to a test spike train. The baseline membrane potential was −54mV. Over the entire data set, the r.m.s. error in the prediction of the peak EJP amplitude was 0.4 mV (8% relative error).

