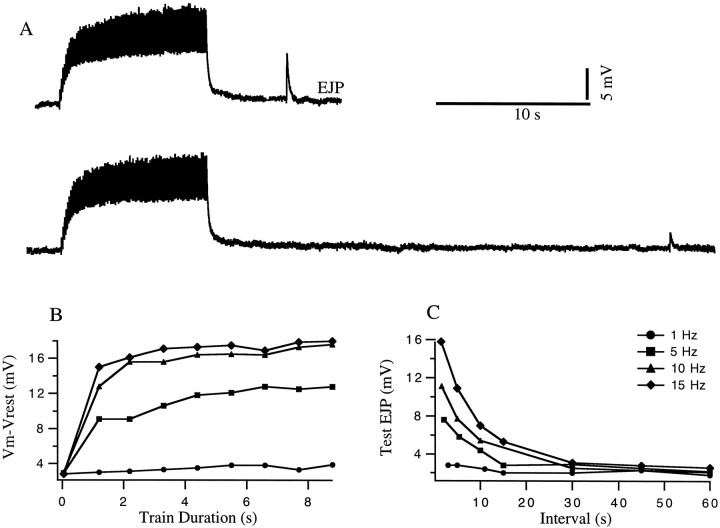
Fig. 2.
Conventional analysis of facilitation.A, EJPs in response to a 10 sec conditioning burst at 10 Hz followed by a test impulse 5 sec and 30 sec after the burst.B, Buildup of facilitation as a function of time for different impulse frequencies during the train. This was obtained by measuring the change in the membrane potential from rest during the 10 sec burst. Symbols are defined in C. C, Decay of facilitation as a function of time for different impulse frequencies during the train. Results were obtained by measuring the amplitude of the test EJP at various intervals after the burst. Data are from a gm8 muscle with a baseline membrane potential of −65 mV.

