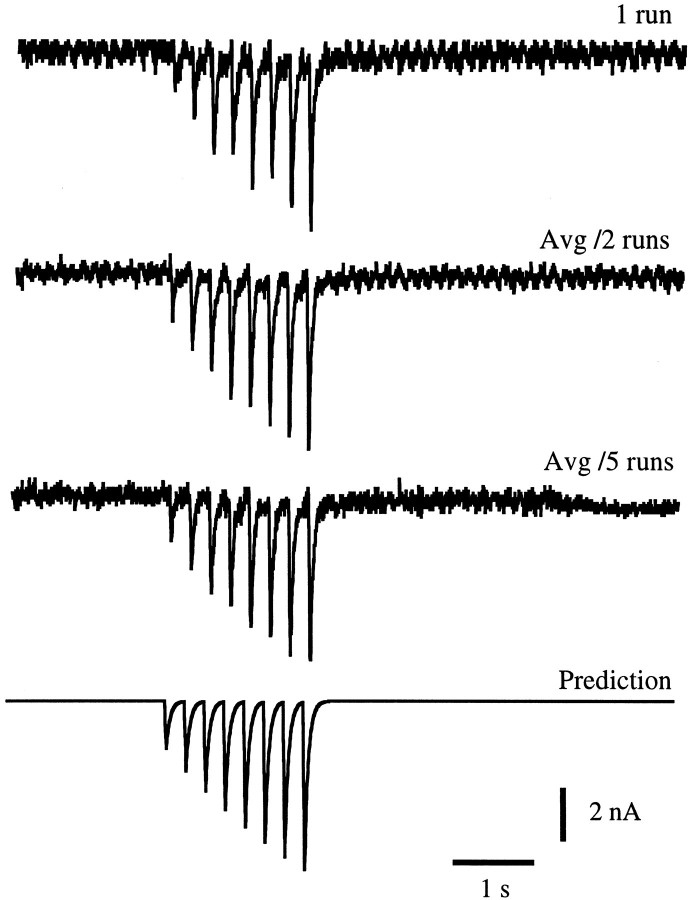
Fig. 5.
Predicting the response to a test train. This figure uses the synapse and fit shown in Figure4A, but involves EJCs evoked by a spike train not included in the training set used in that figure. The top trace shows the actual response during one trial. Thesecond trace shows the average of EJCs evoked by two identical spike trains, and the third trace shows an average of five trials. The bottom trace is the predicted response. The prediction errors for the data shown in these cases were 0.48 nA or 10% for the top trace, 0.34 nA or 7% for the second trace, and 0.24 nA or 5% for thethird trace.

