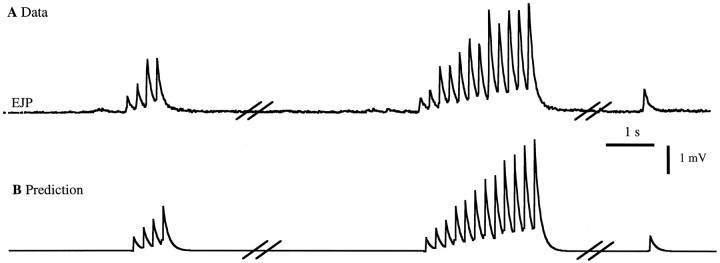
Fig. 8.
Predictions for a spike sequence not in the training set of Figure 7. The breaks in the traces represent time intervals of 20 sec and then 10 sec. A, Measured EJP response. B, The predicted response usingK1, K2, and the nonlinear function of Figure 7. Over the entire data set, the r.m.s. error in the prediction of the peak EJP amplitude was 0.3 mV (12% relative error).

