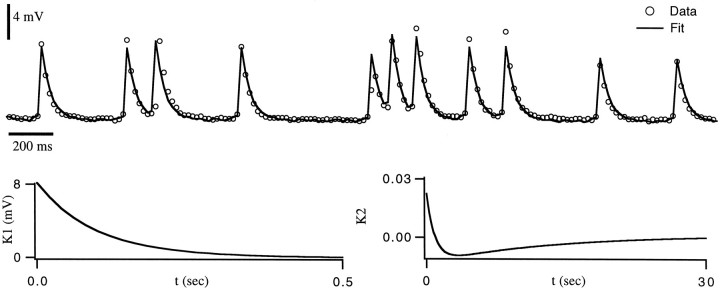
Fig. 9.
A synapse displaying both facilitation and depression. The top trace shows the fit to the EJPs evoked by a random spike train. The functions extracted by the fitting procedure are plotted underneath the EJP trace. The nonlinear functionF is similar to that in other figures and is not plotted. Data are taken from a cpv7 muscle with a baseline potential of −63 mV. Over the entire data set, the r.m.s. error in the prediction of the peak EJP amplitude was 1.3 mV (17% relative error).

