Fig. 2.
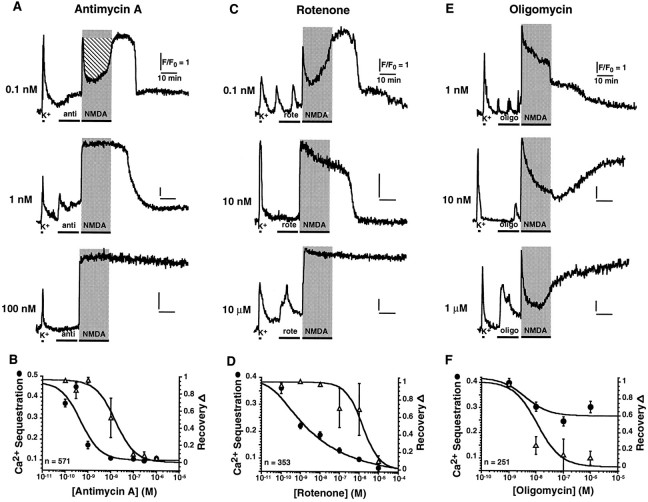
Inhibitors of mitochondrial function modulate homeostasis of [Ca2+]i elicited by a 20 min NMDA stimulus. A, Time course of change in [Ca2+]i for neurons pretreated with antimycin A (anti) for 15 min immediately preceding stimulation with 200 μm NMDA. At 1 nm, antimycin selectively inhibits Ca2+ sequestration; at 100 nm, it abrogates both Ca2+ sequestration and recovery. Calibration of [Ca2+]i on neurons pretreated with 1 μm antimycin A yielded the following values: [Ca2+]baseline = 23 ± 2 nm; [Ca2+]peak = 1.33 ± 0.12 μm; [Ca2+]plateau = 2.7 ± 0.2 μm; n (number of cells) > 36. This indicates that lack of Ca2+ sequestration is not because of saturation of the dye. B, Dose–response for Ca2+ sequestration (•) and recovery (▵). Ca2+ sequestration is quantified as the area above the Ca2+ signal (hatched area inA, top panel) normalized to the rectangular area delimited by the baseline and the peak of the waveform during 20 min NMDA application. Recovery is defined as the fraction of cells that exhibitFend/Fplateau ≤ 0.3. C, Neurons pretreated for 15 min with rotenone (rote). Similar to antimycin, 10 nm rotenone selectively reduces Ca2+ sequestration, whereas 10 μm abolishes both sequestration and recovery.D, Dose–response for Ca2+ sequestration (•) and recovery (▵). E, Neurons pretreated for 15 min with oligomycin (oligo). At ≥10 nm, oligomycin inhibits recovery but has a minor effect on Ca2+sequestration. F, Dose–response for Ca2+sequestration (•; IC50 ≫ 10 μm) and recovery (▵; IC50 = 11.1 ± 2.8 nm). Curves represent best fits to the function y = A0 + A1 · (IC50/([drug] + IC50))h.

