Fig. 4.
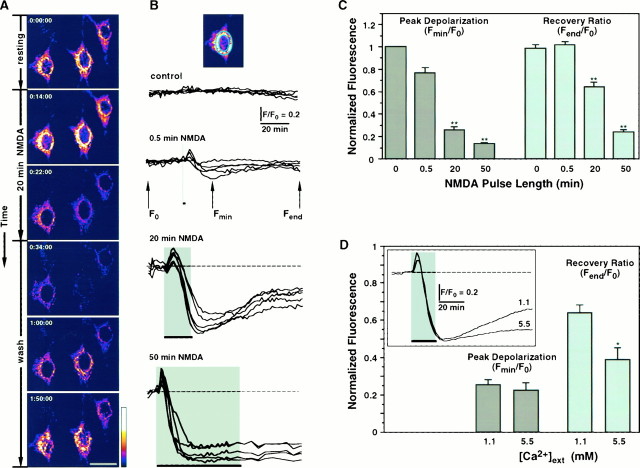
NMDAR overstimulation collapses ΔΨ.A, Digital images of neurons exposed to TMRE before removal of NMDA (top frame indicated by 0:00:00 time), during 20 min stimulation with 200 μm NMDA, and after removal of NMDA (wash). Collapse of ΔΨ is shown as a decrease in fluorescence intensity during exposure to NMDA. Partial repolarization occurs after the stimulus is removed. Pseudocolor scale represents arbitrary fluorescence intensity values ranging from 0 to 255. Scale bar, 20 μm. B, Time course of ΔΨ measured in arbitrary fluorescence units for neurons stimulated with NMDA for 0 (control), 0.5, 20, and 50 min and recorded during 2 hr. Each trace represents mitochondrial fluorescence from an individual neuron normalized to its initial baseline value (F0), and each set of recordings belongs to a single representative experiment.Inset, Perinuclear ring of mitochondrial fluorescence used for quantitation. C, Mitochondrial fluorescence signals, as shown in B, are quantified as Peak Depolarization = Fmin/F0, an indicator of transient mitochondrial depolarization, and Recovery Ratio = Fend/F0, an indicator of mitochondrial repolarization after cessation of the NMDA stimulus. Bars plotted for 0, 0.5, 20, and 50 min NMDA represent mean ± SEM for n = 28, 28, 74, and 84, respectively. For both bar charts, ANOVA analysis revealed that populations are different with p < 0.00001. **, Statistically significant differences (p < 0.0001) compared with all other treatments using the post hoc test. D, Effect of [Ca2+]ext on depolarization of ΔΨ elicited by 20 min NMDA. Bar chart for Peak Depolarization and Recovery Ratio was calculated and plotted as in C. *, Statistically significant difference with p < 0.002. Inset, Comparison of the time courses of ΔΨ in the presence of [Ca2+]ext = 1.1 or 5.5 mm. Traces are averages from all recordings (5.5,n = 33; 1.1,n = 74).

