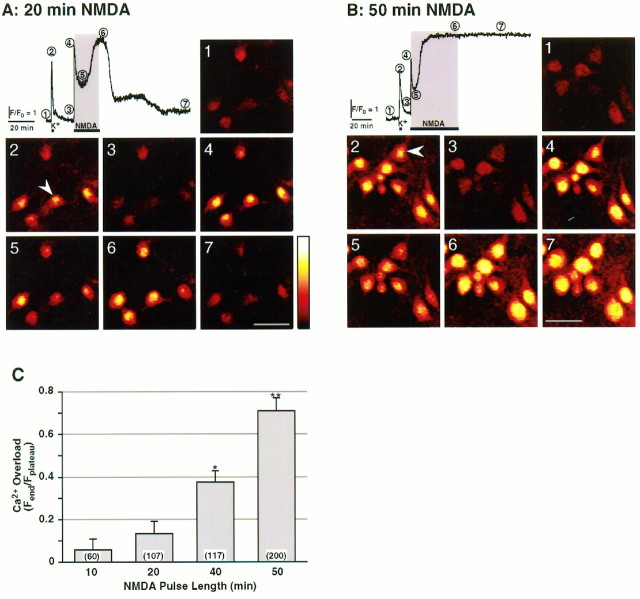
[Ca2+]i (4) followed by a slow decrease to a lower level lasting several minutes (5), which gradually increases to achieve a higher plateau [Fplateau, (6)]. [Ca2+]i returns to baseline levels shortly after the NMDA stimulus is removed (7). Record obtained from the neuron marked with an arrowhead. Scale bar, 40 μm. B, Same as A, but neurons were stimulated for 50 min with NMDA. A similar time course was recorded, but heightened [Ca2+]i(6) failed to return to baseline levels [Ca2+ overload, (7)]. Calibration of [Ca2+]i yielded the following values: (1) [Ca2+]baseline = 29 ± 2 nm; (2) [Ca2+]K+ = 0.91 ± 0.10 μm; (4) [Ca2+]peak = 1.5 ± 0.2 μm; (5) [Ca2+]valley = 0.29 ± 0.03 μm; (6) [Ca2+]plateau = 2.1 ± 0.2 μm; n (number of cells) > 47. C, Extent of Ca2+ overload versus duration of the NMDA challenge. Ca2+ overload was calculated as the ratio of the fluorescence value at the end of the experiment [Fend, (7)] to the highest value achieved during the challenge [Fplateau, (6)]. Data are mean ± SEM. ANOVA analysis revealed that populations are different with p < 0.00001. *, Statistically significant difference (p < 0.005) obtained using the post hoc test compared with all other treatments; **p < 0.0001. Numbersin parentheses denote population sizes. {/ANNT;64064n;;66880n;72864n}

An official website of the United States government
Here's how you know
Official websites use .gov
A
.gov website belongs to an official
government organization in the United States.
Secure .gov websites use HTTPS
A lock (
) or https:// means you've safely
connected to the .gov website. Share sensitive
information only on official, secure websites.
