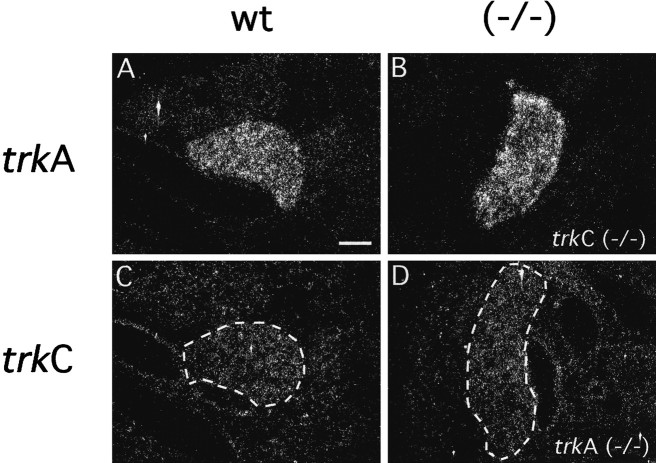
Fig. 8.
trkA and trkC gene expression in the SCG of E15.5trkC−/− andtrkA−/− embryos, respectively. Sections derived from (A) wild-type and (B)trkC−/− animals were submitted toin situ hybridization using a probe specific fortrkA transcripts. Sections derived from (C) wild-type and (D)trkA−/− animals hybridized with a probe specific for trkC transcripts. The SCG shown inD appears larger than that in C because they are in different planes of section. Scale bar, 10 μm.

