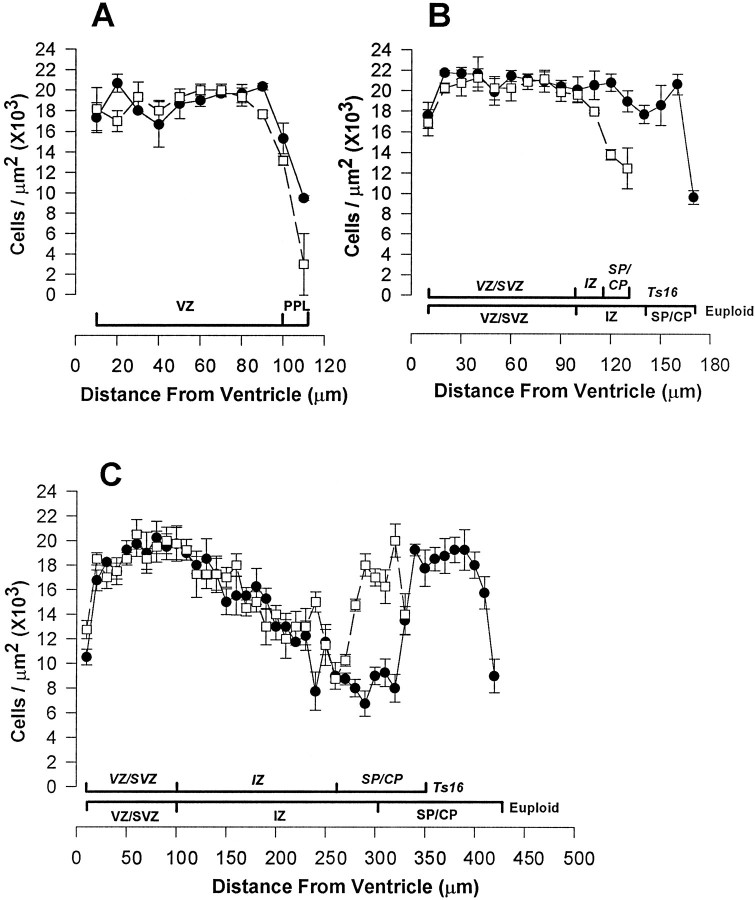
Fig. 6.
Density plots across Ts16 (filled circles) and euploid (open squares) cortices. Data represent mean ± SEM (n = 6). At E13 (A), the plots overlap throughout the cortex. At E14 (B), Ts16 and euploid cell density plots overlap up to the IZ (see brackets underneath plot), but the Ts16 plot deviates from euploid through the IZ and SP/CP because the Ts16 cortex is smaller. At E16 (C), the density plots overlap through the Ts16 IZ. Relative cell densities of the VZ/SVZ, IZ, and SP/CP are not different between Ts16 and euploid at any age.

