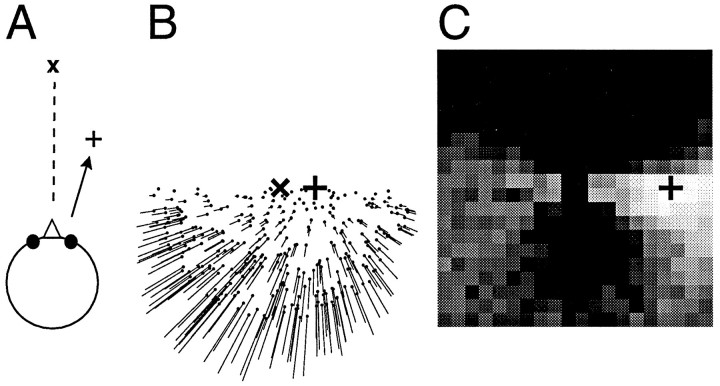
Fig. 2.
Example of a network simulation. A, An observer moves on top of a ground plane into a direction indicated by the plus sign (+), which keeps a constant angle with the direction of gaze (x). B, The resulting optic flow field, which is used as input to the network, is a pure expansion with the singular point, i.e., the focus of expansion, located in the direction of the movement (+). C, The population activities in the second layer of the network as a grayscale map. Each square corresponds to one possible direction of heading. The brightness of the square indicates the activity of the population that represents this direction. The computed direction of heading corresponds to the brightness peak and is close to the correct direction (+). Note that the flow field and the output map are drawn on different scales. The diameter of the flow field is 100°, whereas the side length of the output map is only 40°.

