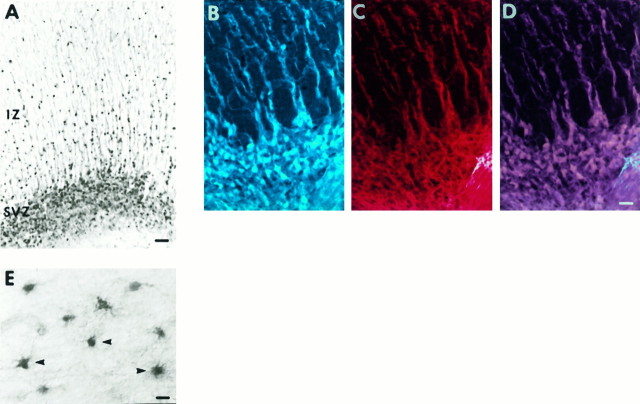
Fig. 11.
Analysis of trkB immunoreactivity in relation to developing and mature glial populations. A, P10 sagittal section stained with anti-trkB146 (1 μg/ml) showing trkB-immunoreactive cell bodies and fibers within and emanating from the SVZ. B–D, P10 sagittal section, stained with mouse anti-vimentin (1:6) and with anti-trkB146 (2 mg/ml), followed by Texas Red-conjugated anti-mouse IgG (1:200) and FITC-conjugated anti-rabbit IgG (1:200).B, Pseudo-colored confocal image of vimentin immunoreactivity. C, Pseudo-colored confocal image of trkB146-immunoreactivity within the identical field as inB. D, Superimposition of the images shown in B and C. Singly labeled adjacent sections showed no bleed-through between filters under identical conditions to those used in the double-immunofluorescence analysis (data not shown). Immunofluorescence images were obtained using a Bio-Rad 600 confocal microscope. E, Higher-magnification image, using DIC optics, of trkB146-immunoreactive cells in the cortical white matter at P24. Arrowheads point to cells with morphology characteristic of mature astrocytes. Abbreviations as in earlier figures. Scale bars: A, 70 μm; B–D, 18 μm; E, 13 μm.

