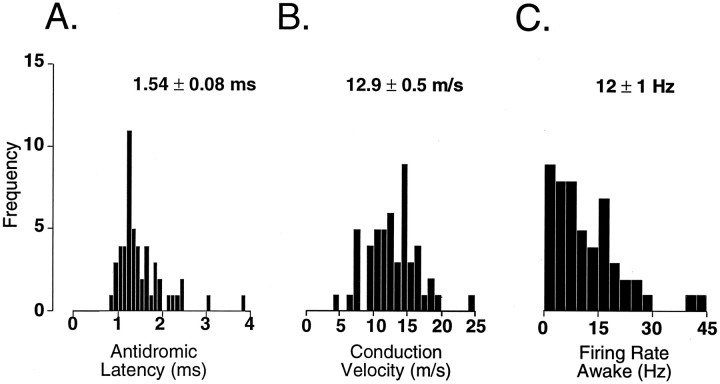
Fig. 2.
Histograms illustrating the distribution of antidromic latency-to-onset (A), conduction velocity (B), and mean ongoing spike discharge (C) of 51 TGT neurons recorded during the behavioral state of wakefulness. A population mean ± SE is located above each histogram. Calculated means for antidromic latency-to-onset and conduction velocity do not differ from those reported in anesthetized cats (Sessle and Greenwood, 1976; Ro and Capra, 1994); however, unlike TGT neurons recorded in anesthetized cats (Hu et al., 1981; Ro and Capra, 1994), >90% of TGT neurons recorded during wakefulness exhibited ongoing spike activity.

