
Fig. 6.
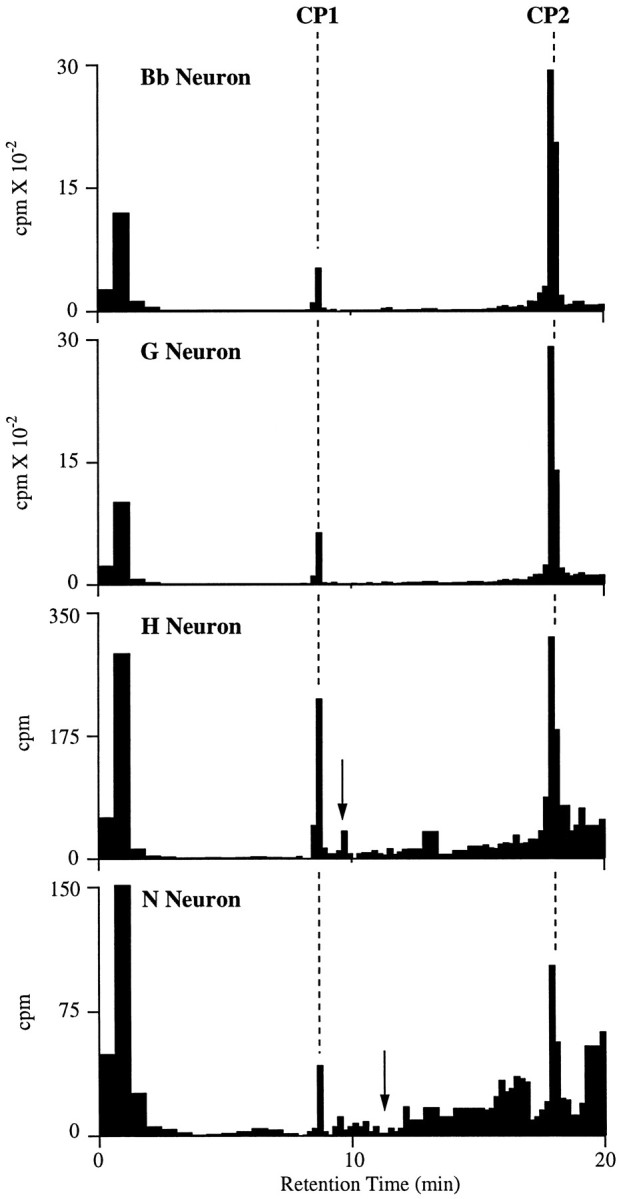
Examples of HPLC of extracts from individual neurons dissected from clusters in the cerebral ganglia that were positive for CP1-lir and CP2-lir. Cell extracts were run with HFBA as the counterion. Dashed lines indicate the retention times of synthetic CP1 and CP2 as monitored by absorbance. For each neuron, the identities of CP1 and CP2 were confirmed by running aliquots from these peaks on HPLC with TFA as a counterion.Arrows represent the retention times for synthetic BuA in the H neuron profile and synthetic MmA in the N neuron profile (see text). Aliquots of the peak that seems to coelute with BuA in the H neuron profile on this gradient did not coelute with BuA when run with TFA as a counterion. In this and the next figure, unincorporated [35S]methionine is the predominant component of the broad peak, with brief retention time (0–3 min) that in some cases is truncated (i.e., N Neuron).