Fig. 12.
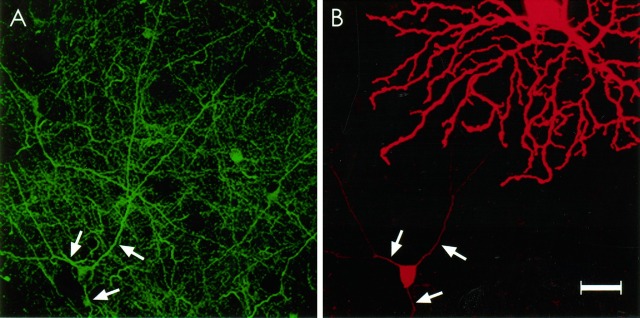
Bottom. A,Left, Green processes indicate G6-gly immunoreactivity in a whole-mount preparation. Arrowsindicate the primary dendrites of a large G6-gly-IR amacrine cell. Note that most of the other processes are smaller in diameter.B, Right, The same volume of tissue asA, containing a Neurobiotin-injected ON-parasol ganglion cell (top right) with a large, tracer-coupled amacrine cell (bottom left). Arrows indicate the same dendrites as in A, which are double-labeled. Both images represent a reconstructed stack of optical sections spanning from the ganglion cell layer to the middle of the IPL. Scale bar, 25 μm.

