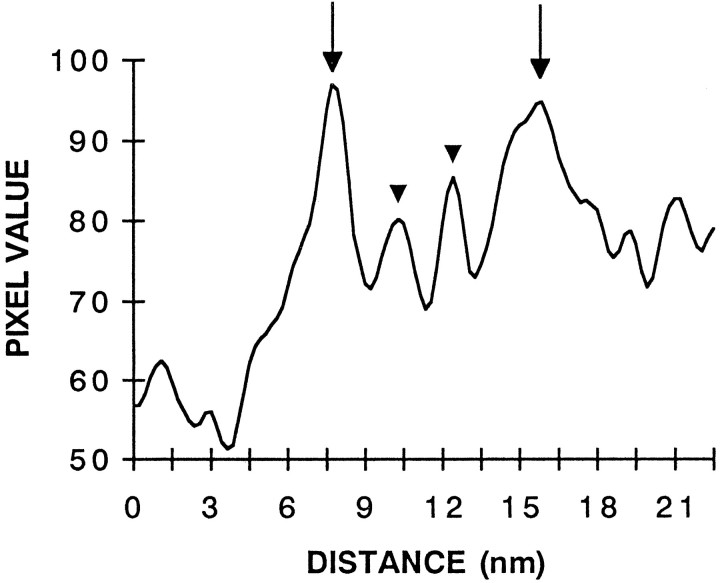
Fig. 8.
Densitometric scan of the gap junction illustrated in Figure 7. The peaks (arrows) indicate the densest portions of the inner leaflets. The outer leaflets (arrowheads) were not as well defined as they would have been with conventional fixation and en bloc staining, however, and it was not always possible to visualize the gap between them. The baseline is higher on the right because of the peroxidase reaction product in the labeled parasol cell.

