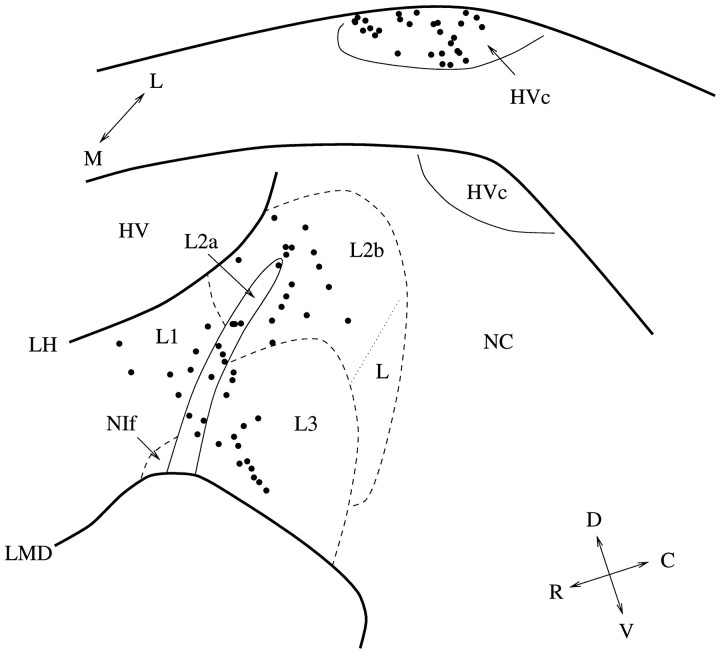
Fig. 3.
The anatomical sites of the neurons analyzed in this study (note that because spikes were sorted using a software discrimination algorithm, some sites may contain more than one isolated neuron). The upper diagram shows the sites in HVc, and thelower diagram shows the sites in field L. The average medial–lateral position was 2.3 mm (range 1.8–2.65) for HVc and 1.5 mm (range 1.1–1.9) for field L. Area L2a of the field L complex as well as HVc can be clearly identified in cresyl violet-stained sections. The dashed lines indicate the approximate anatomical areas as described by Fortune and Margoliash (1992).

