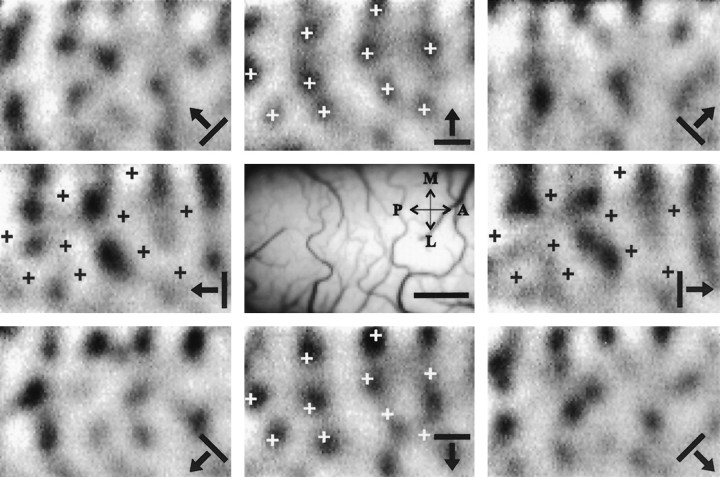
Fig. 1.
Activity patterns evoked by gratings moving in various directions. Eight different gratings, each moving in two opposite directions, were presented to the cat while activity maps were collected. A subset of eight orientation and direction single-condition optical maps is presented. Dark patches in each image represent cortical areas that were active while the cat was stimulated with gratings whose orientation and direction are marked on the image. The four sets of crosses are marked on identical cortical locations to enable easy comparison of the patterns of activity. Theimage in the center is the image of the cortical surface and superficial blood vessels, taken under green illumination (540 nm). Each of the different stimuli selectively activated a small number of patches in the imaged area. Maps produced by gratings of similar orientation, but opposite direction of motion (180° apart), were similar to one other. Gratings at orthogonal orientations activated complementary patches. The maps are scaled such that the whole range of gray levels corresponds to a fractional change of 3.2 × 10⁻⁴ for presenting the activity maps. The wavelength of illumination used for imaging (hereafter wavelength) was 650 ± 10 nm. A, Anterior; P, posterior; M, medial; L, lateral. Scale bar, 1 mm.

