
Fig. 2.
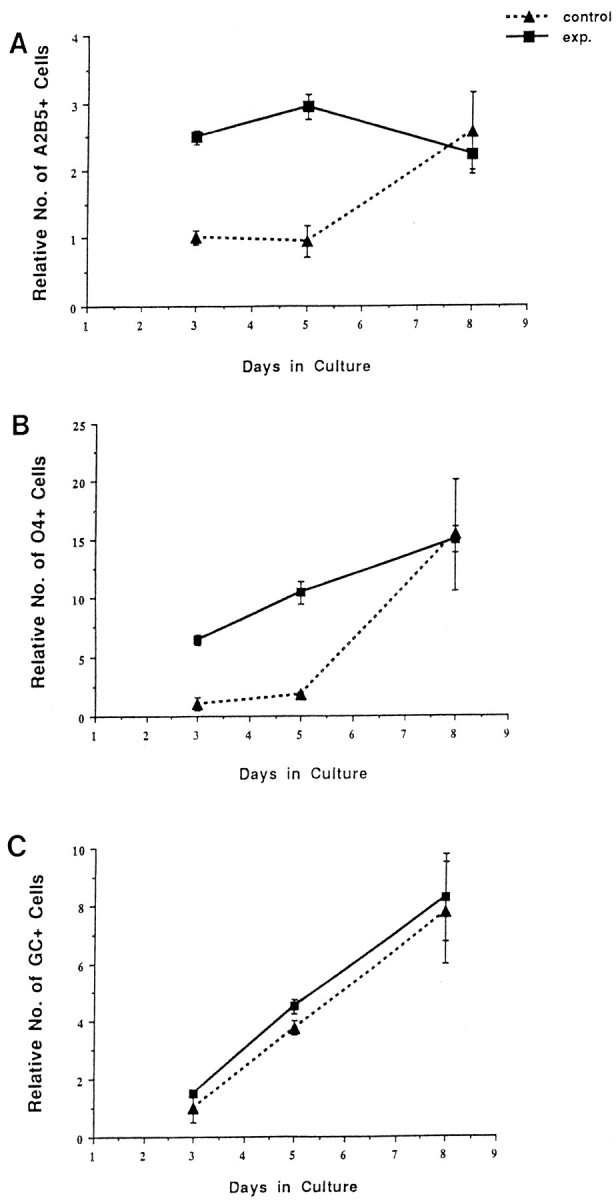
The number of oligodendrocyte lineage cells in base and experimental cultures normalizes during 6 d of culture.A, The relative number of A2B5+ cells. Although experimental cultures contained two to three times more A2B5+ cells 1 d after addition (day 3), 6 d later, both control and experimental cultures contain similar numbers of cells. B, The relative number of O4+cells. As with A2B5+ cells, the number of O4+cells in base and experimental cultures normalizes over the 6 d culture period. Note that the number of O4+ cells increases in both cultures. C, The relative numbers of Rmab+ cells in base and experimental cultures. Although both cultures show an increase in Rmab+ cells, there is no difference in the number of Rmab+ cells between base and experimental cultures. The data represent one experiment, because the initial relative number of cells of each phenotype varied among individual experiments.