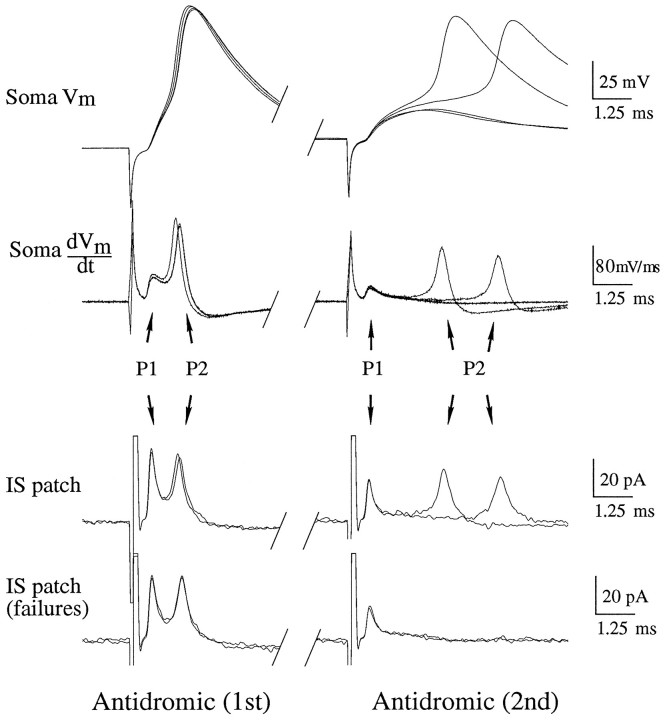
Fig. 3.
Sequence of antidromic action-potential (AP) invasion of initial segment (IS) and soma. Dual-recording electrode positions are as in Figure 1. Waveforms are individual sweeps. Antidromic (1st), Leftcolumn shows response to a single antidromic AP. Antidromic (2nd), Rightcolumn is the response to the second of a pair of antidromic APs. Soma Vm, Membrane potential recorded through the somatic whole-cell electrode. Soma dVm/dt, Time derivative of the somatic membrane potential. IS patch, Cell-attached patch recording in the IS. The current recorded is primarily capacitive and, thus, is proportional to the time derivative of the transmembrane potential of the patch. IS patch (failures), Cell-attached recordings in the IS, in which the second antidromic action potential failed to invade the soma. P1 corresponds to the peak in the response attributable to charging of the patch by channels in the IS.P2 corresponds to the charging of the patch by somatic Na+ channels, which does not occur when the second somatic AP fails. See text for details. RMP, −63 mV. Cell c95066a.

