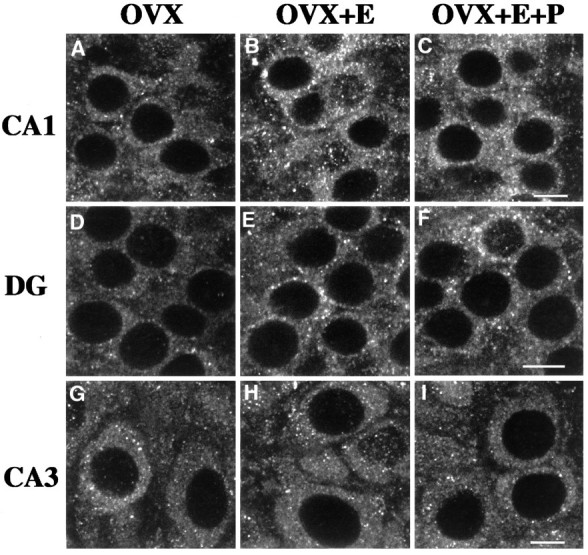
Fig. 2.

Examples of CLSM images of NMDAR1 immunolabeled somata in CA1 (A–C), the dentate gyrus (D–F), and CA3 (G–I) of OVX (A,D, G), OVX+E (B,E, H), and OVX+E+P (C, F, I) rats. Note the presence of punctate staining within the cytoplasm surrounding the unlabeled nuclei (see Discussion). When comparing the CA1 fields, an increase in the somatic intensity of staining is evident in the OVX+E and OVX+E+P rats (B, C) as compared with the OVX rats (A). This increase in the steroid-treated ovariectomized rats is also apparent in the dentate gyrus (E, F compared withD), although to a lesser extent. There is no obvious difference in intensity levels among the three groups in the CA3 field (G–I). DG, Dentate gyrus; OVX, ovariectomized rats; OVX+E, estradiol-treated ovariectomized rats; OVX+E+P, estradiol plus progesterone-treated ovariectomized rats. Scale bars, 10 μm.
