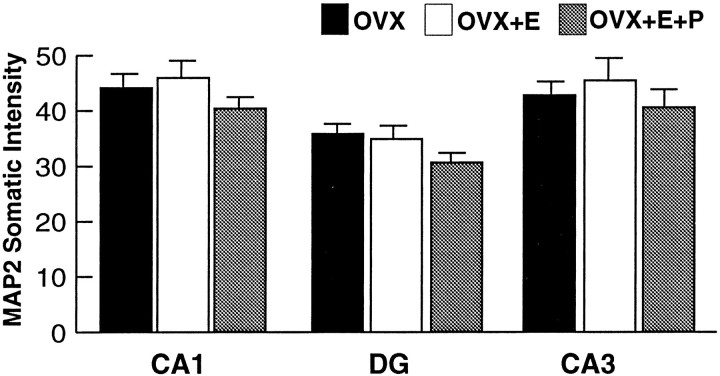
Fig. 6.
Bar graphs depicting MAP2 immunofluorescence intensity measurements in the somata of the CA1, dentate gyrus, and CA3 fields of the hippocampus. Quantitative analysis revealed no statistically significant differences among the three groups when comparing within a hippocampal field. Values represent mean ± SEM for six OVX rats, five OVX+E rats, and OVX+E+P rats (24 measurements per rat).

