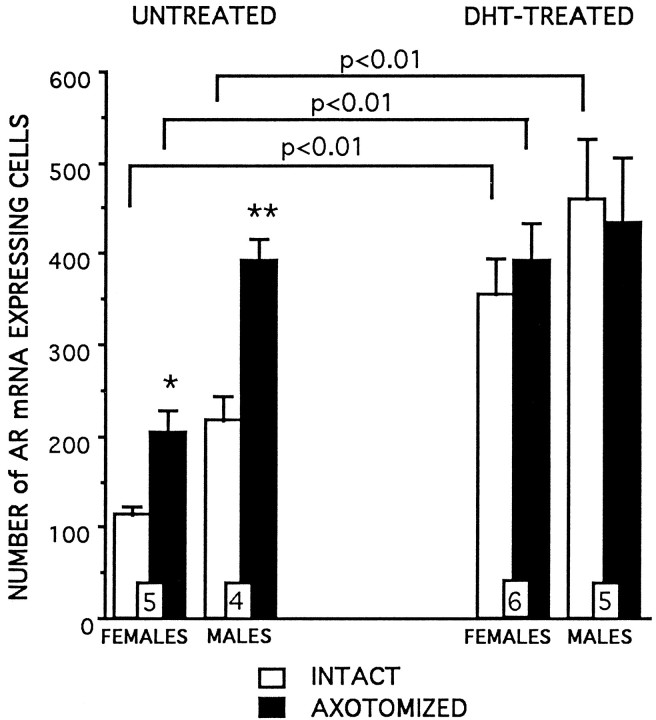
Fig. 4.
Number of AR mRNA-expressing cells (mean ± SEM; n = number of animals within histogram bars) in the intact (white) and axotomized (black) N. IX–X of untreated and DHT-treated animals 1 month after axotomy. Asterisks indicate significant differences between intact and axotomized sides (*p < 0.05, **p < 0.01). Brackets with significance information show differences between untreated and DHT-treated groups. In untreated animals, more AR mRNA-expressing cells were found in the axotomized side than in the intact side. The number of AR mRNA-expressing cells was significantly higher in both intact and axotomized sides of DHT-treated juveniles than the respective sides of untreated juveniles. The number of AR mRNA-expressing cells in the intact side of DHT-treated males was significantly higher than in untreated males.

