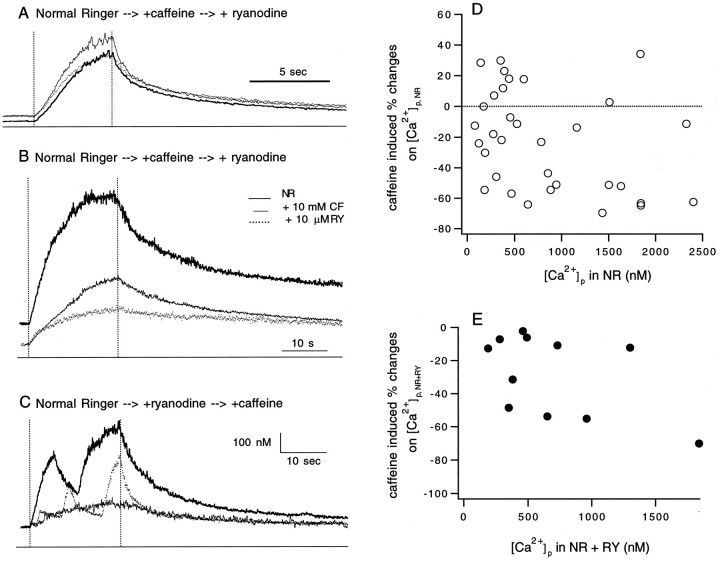
Fig. 12.
Effect of caffeine on Δ[Ca2+]i. A–C, The superimposed traces are the Δ[Ca2+]i in response to 20 Hz nerve stimulation collected in normal Ringer solution (NR), 10 μm ryanodine (RY), and 10 mm caffeine (CF). For each panel, the duration of the stimulation is indicated by the vertical dotted lines, the 0 [Ca2+]i level is marked by the line below the traces, and the order by which CF and RY were added to NR is labeled at the top. D, Effects of 10 mm CF on the peak [Ca2+]i([Ca2+]p) compared to that in NR ([Ca2+]p,NR) are plotted against their corresponding [Ca2+]p in NR (33 responses in 10 units). The percent effects were calculated as 100 × [([Ca2+]p,CF/[Ca2+]p,NR) − 1]. The positive values indicate facilitation, whereas the negative values indicate inhibition. E, Inhibitions caused by 10 mm CF on [Ca2+]p compared to that in NR with 10 μm RY added ([Ca2+]p,(NR+RY)) are plotted against their corresponding [Ca2+]p in NR + RY (11 responses in 4 units). The effects were calculated as 100 × [([Ca2+]p,CF/[Ca2+]p,(NR+RY)) − 1]. Note that after ryanodine treatment, caffeine caused only inhibition.

