Fig. 9.

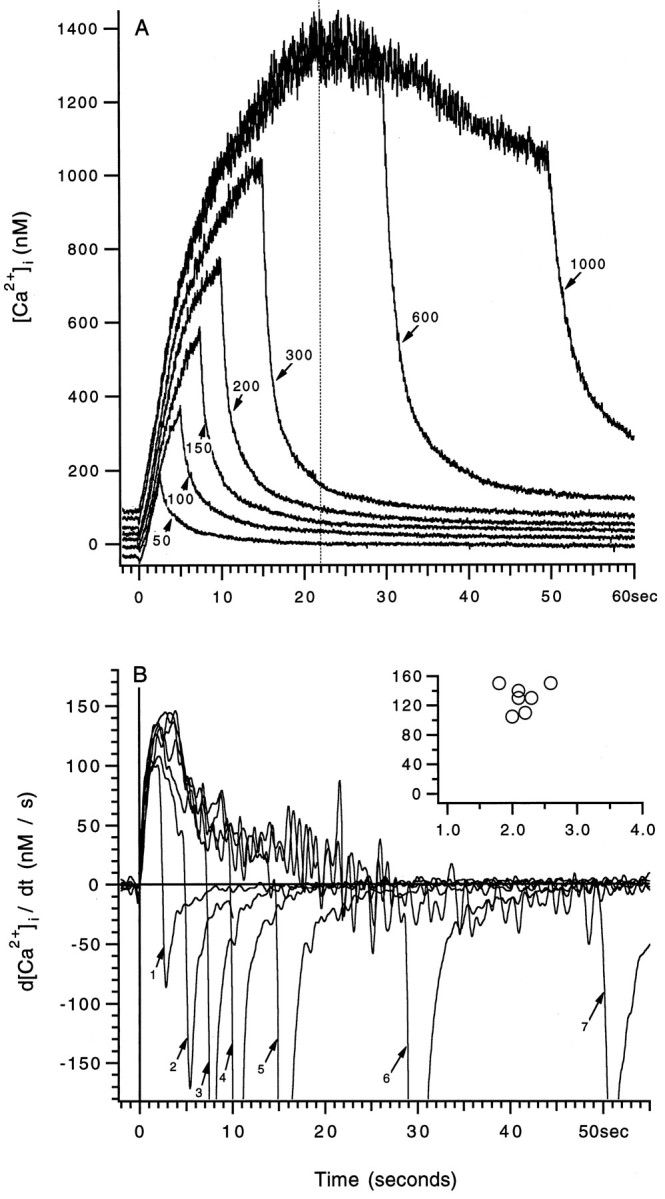
The functional capacity, the rate of discharge, and the recovery of the intraterminal ryanodine-sensitive Ca2+ store in a unit. A, Temporally superimposed difference traces of [Ca2+]i were obtained by subtracting the records collected in RY (data in Fig. 6B) from those collected in NR (data in Fig. 6A) that were evoked by the same stimulation. For each trace, the number of stimuli in the stimulation is indicated. B, The traces are the rates of discharge of the ryanodine-sensitive store (i.e., the time derivative of the difference traces in A) in response to 50, 100, 150, 200, 300, 600, and 1000 stimuli, correspondingly, labeled as1–7. Note that the peak rates for the responses were very similar in both their amplitudes and their times of occurrence. The maximum rates of discharge for the seven responses are plotted against their times of occurrence in the inset of B. For all panels, time 0 corresponds to the beginning of stimulation.
