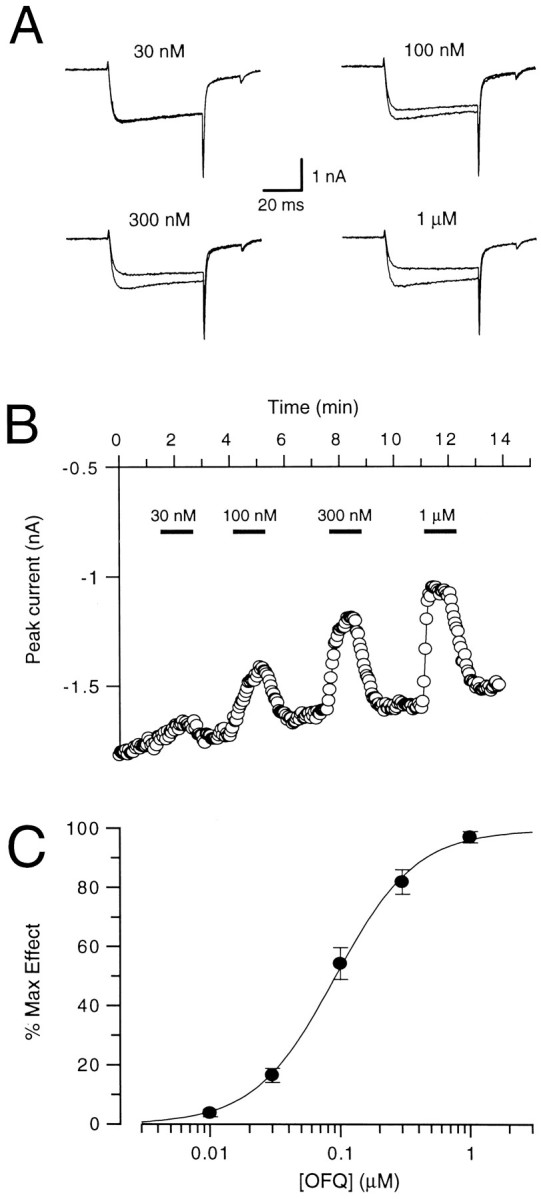
Fig. 3.

Concentration-dependence of the effect of OFQ on high-voltage-gated Ca2+ channel currents. A, Whole-cell currents evoked by 50 msec voltage steps to 0 mV from a holding potential of −80 mV. The traces of the currents obtained in the absence and presence of the indicated concentrations of OFQ are shown superimposed. B, Time course of the effect of OFQ. The ligand was applied in increasing concentrations for 1 min at 3 min intervals while whole-cell currents were elicited at 3 sec intervals.C, OFQ concentration–response curve. The values of the inhibition of the Ca2+ channel peak current amplitudes obtained with different concentrations of OFQ were fitted individually for each neuron and normalized to the maximum of the fit (100%). The normalized values are plotted as a function of the orphanin FQ (OFQ) concentration. The points represent the mean ± SEM of four neurons, and the sigmoidal curve represents a fit through these points.
