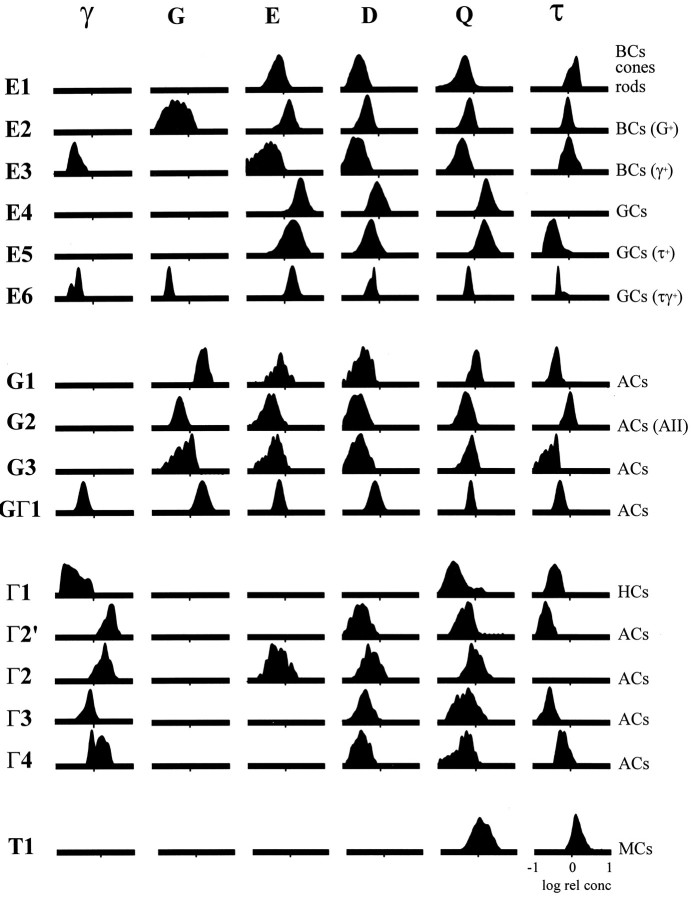
Fig. 13.
The signature matrix for the central primate retina. The left column identifies the theme class, and the right column identifies the cell class. Amino acids are grouped in vertical columns: GABA (γ), glycine (G), glutamate (E), aspartate (D), glutamine (Q), and taurine (τ). Each column demonstrates the distribution of a single amino acid across all theme classes, and each row is the univariate signature for each class. All probability density distributions are amplitude-normalized; the ordinate denotes the relative spectral density along an abscissa of increasing relative log amino acid concentration. Histograms were FFT-filtered to yield a resolution of ∼16 Hz, i.e., 16 unique concentration levels in 0.125 log unit steps in discrete terms. Signals with means ≤ −1 log units relative concentration are not included. BC, Bipolar cell;GC, ganglion cell; AC, amacrine cell;HC, horizontal cell; MC; Müller’s cell.

