
Fig. 14.
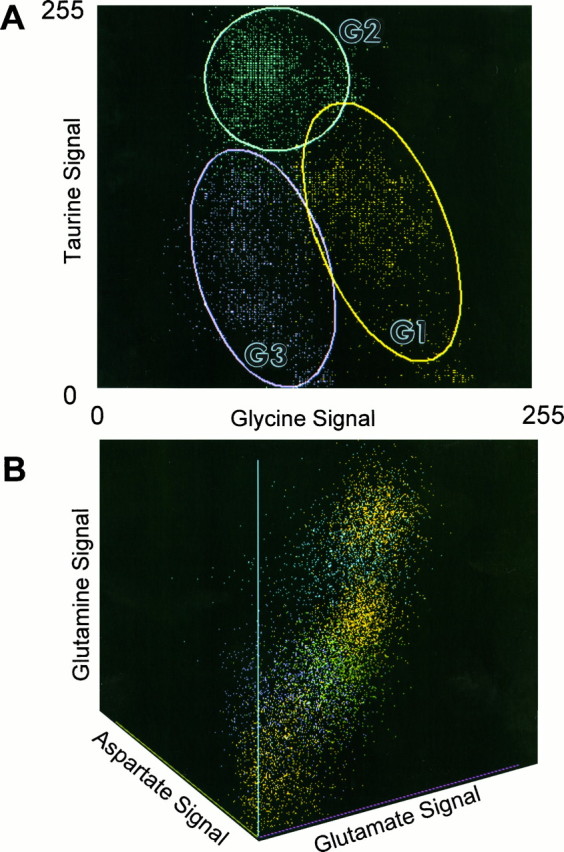
Bivariate and trivariate scatterplots of theme class amino acid signals. A, Glycine versus taurine distribution for the G theme class, demonstrating the nearly univariate separation of G2 (cyan) cells fromG1 (yellow) and G3(purple) cells. Conversely, no univariate signal statistically separates G1 and G3 cells, but they do separate in N-space because of signal covariance within a class. The points are subsets of all the data points from G cells in retina at 1–3 mm eccentricity, and the ellipses represent the 2 SD bounds of the distributions. B, The coherent distribution of glutamate, aspartate, and glutamine signals from various Eand G cells. Sample points from each theme class are denoted as various colors (E1′, E2, and E4cells as various yellows; E1 and E2′cells as blues; E3 cells as magenta; and G1 cells as green). Although it is not possible to sort out the groupings, the important point is the apparent monotonic relationships along the glutamate/glutamine and glutamate/aspartate dimensions. A detailed dissection of some of these groups is shown in Figures 15 and 16.