
Fig. 16.
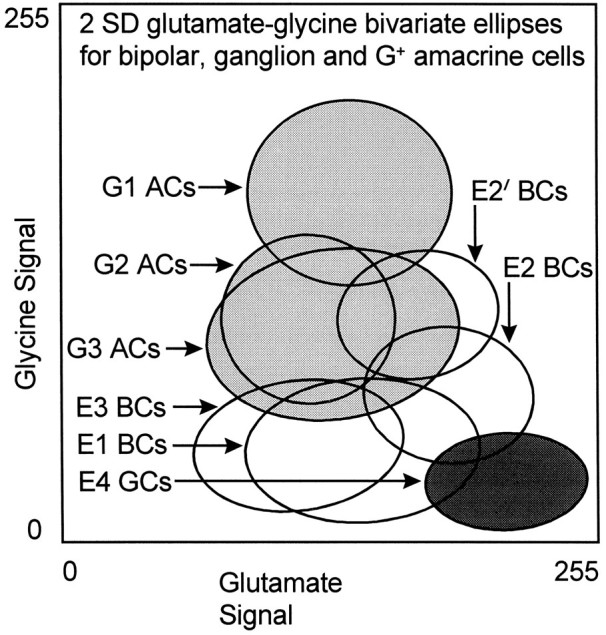
Bivariate single class 2 SD ellipses of glutamate and glycine signals across type E and G cells. In particular, note the stratification of cells into low glycine and high glycine regimes and the separations of E2 and E2′bipolar cells into two modes. Abbreviations defined in legend to Figure13.