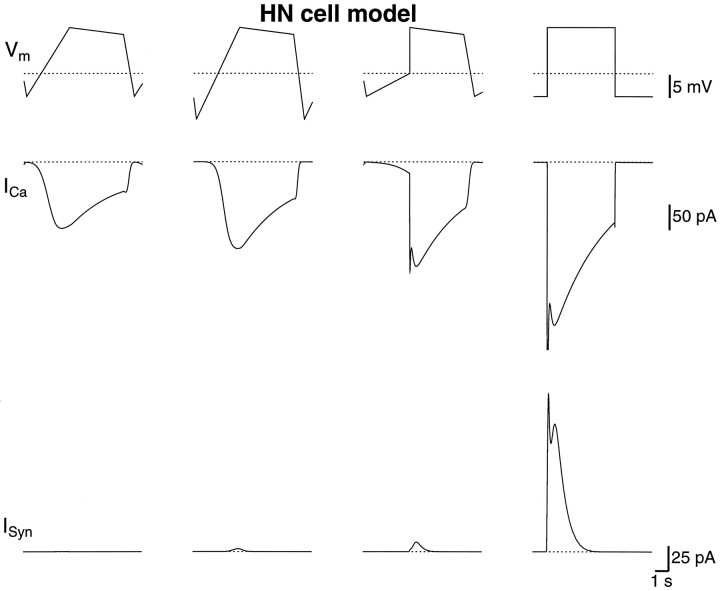
Fig. 5.
The Ca2+ and graded synaptic currents in the model with different applied waveforms. The protocol in the previous figure was repeated in the model. As in the HN cells, the normal waveform gave smaller Ca2+ currents and graded synaptic currents than the other waveforms. The Ca2+currents were slightly larger than in the HN cells, and the shape of the Ca2+ currents matched those measured in the HN cells. For the step waveform, the graded synaptic inhibition was similar to the inhibition measured in the HN cells, whereas the inhibition was smaller than in the HN cells for the other three waveforms. The maximum conductance of the graded synapse was 30 nS. The postsynaptic cell was held at −40 mV. The dotted lines indicate −50 mV and 0 current.

