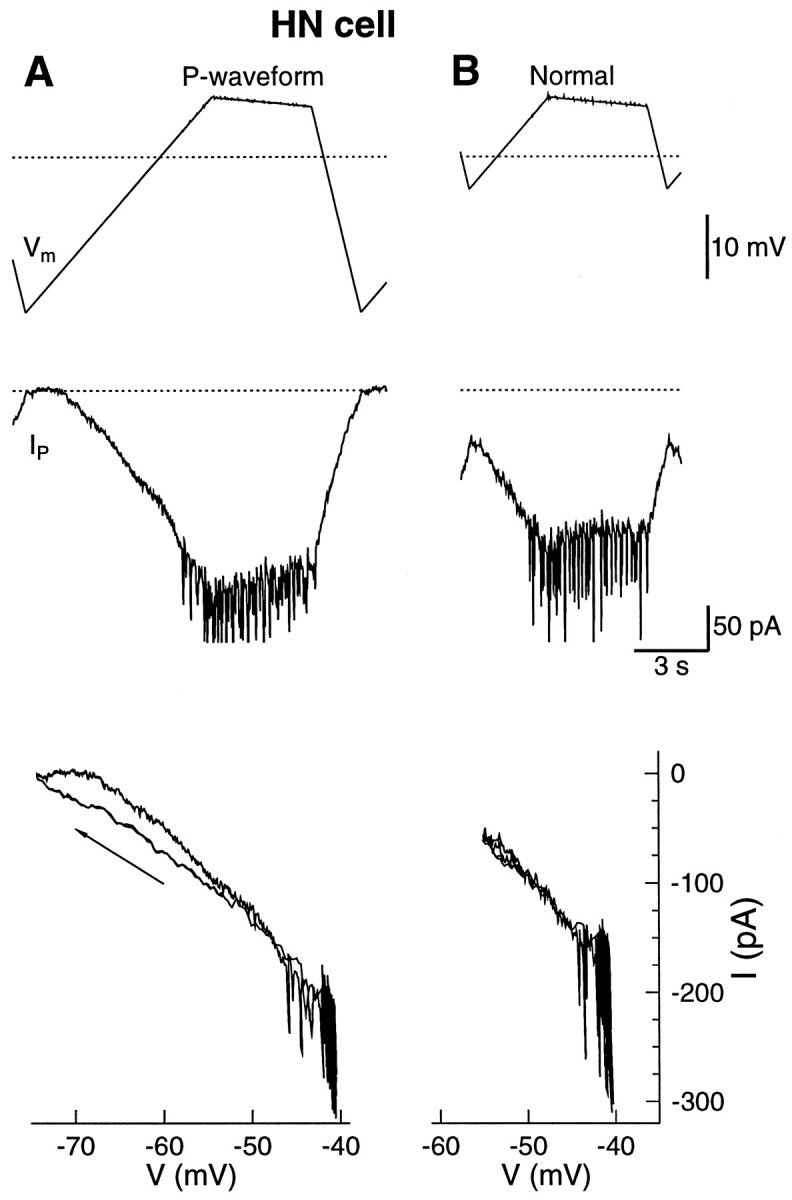
Fig. 6.

The P-current in an HN(3,R) during the P-waveform and the normal waveform. The Ca2+ in the saline was substituted with an equimolar concentration of Mn2+, and the outward currents were blocked by TEA in the electrodes.A, A waveform that reached more hyperpolarized membrane potential was required to calculate the leak conductance and reversal potential (top). The waveform produced around 220 pA. P-current (middle). The spikes in the record were action potentials that escaped voltage control. The P-current was activated above −65 mV and had negligible inactivation (bottom). Thearrow in the I–V plot indicates the down-ramp.B, The normal waveform was applied between two series of the P-waveform. The average leak conductance and reversal potential from the two series of the P-waveform were used to calculate the leak current. The P-current ranged from a minimum of 60 pA during the hyperpolarized phase to a peak of 180 pA during the plateau. The voltage range of the I–V plot in B is smaller. The dotted lines indicate −50 mV and 0 current.
