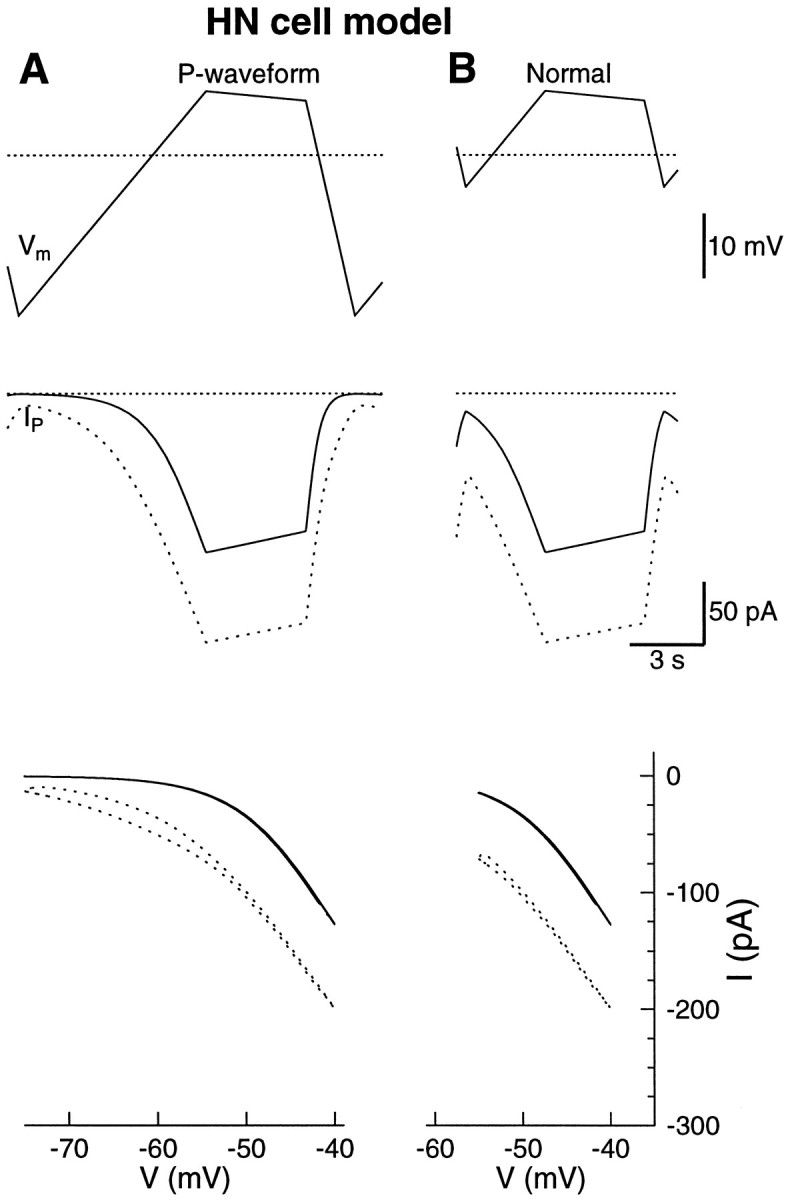
Fig. 7.

The P-current in the model had a steeper activation curve than the measured P-current. The new model P-current that matches the experimental data in Figure 6 is shown in dotted lines. A, The waveform used to calculate the leak current by the same procedure as in the experiments (top). The threshold for activation of the P-current in the model was higher and steeper (middle, bottom). B, The normal waveform produced 130 pA of P-current. The minimum value of the P-current was 15 pA, which was less than what was found in the HN cells. The dotted lines indicate −50 mV and 0 current.
