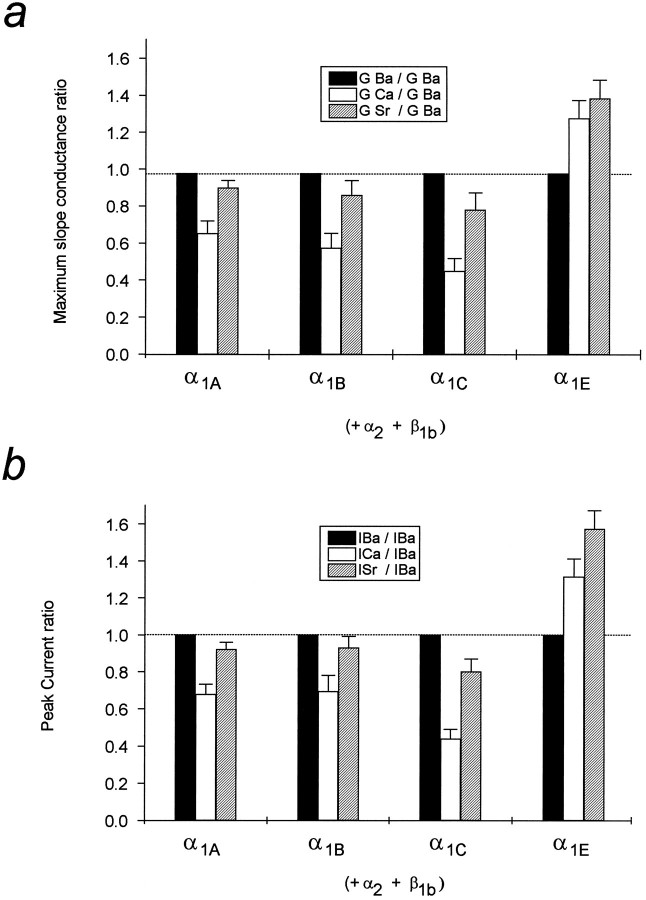
Fig. 2.
Summary of the conductance properties of the different channels. Apparent maximum slope conductances obtained from fits to individual I–V relations are compared ina. Values are presented in the form of conductance ratios (Gion/GBa).b, The peak current values from the same experiments, normalized to those seen in Ba (Imax(ion)/Imax(Ba)). Note the different permeation profile of the α1E channel. Error bars are SE based on 5–14 determinations.

