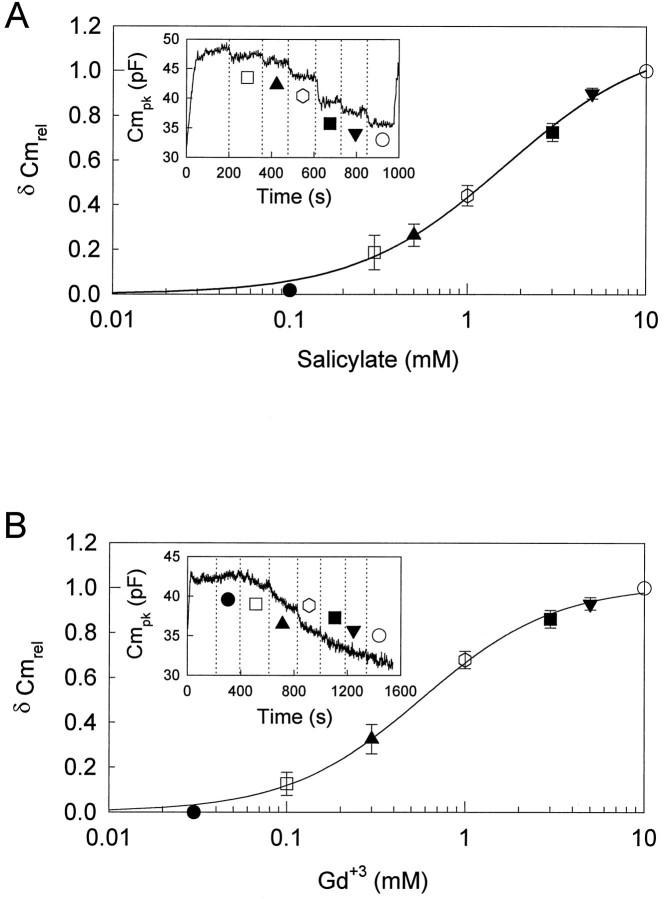
Fig. 4.
Concentration–response curve for reduction inCmpk by salicylate and GdCl3. A, The concentration–response curve for salicylate. The inset shows the effect on theCmpk by various concentrations of salicylate in a representative example. Rs, 5.5 MΩ; Rm, 450 MΩ. Pipette pressure was kept at 0 kPa. Reductions of Cmpkinduced by various concentrations were normalized to the reduction induced by 10 mm salicylate. Each point is the mean ± SE of five cells. B, The concentration–response curve for GdCl3. Theinset shows the effect on theCmpk by various concentrations of GdCl3 in a representative example.Rs, 6.5 MΩ;Rm, 400 MΩ. Pipette pressure was kept at 0.11 kPa. Reductions of Cmpk induced by various concentrations were normalized to the reduction induced by 10 mm GdCl3. Each point is the mean ± SE of five cells determined at the end of each perfusion.

