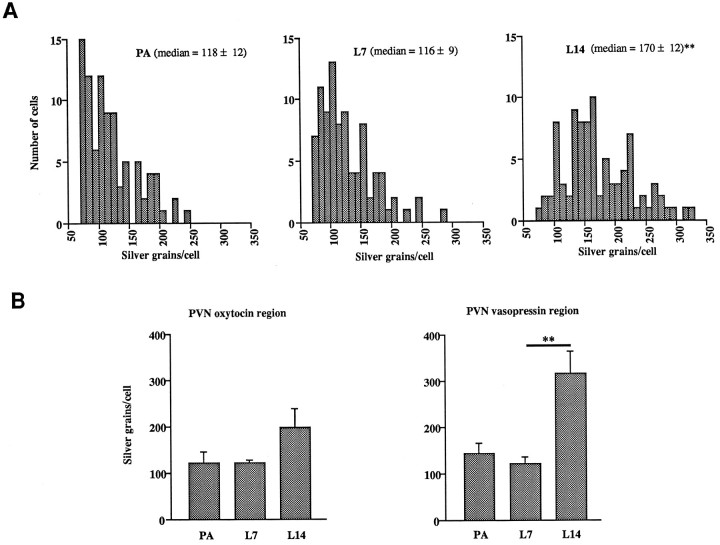
Fig. 5.
A, Frequency distribution histograms of silver grains per magnocellular cell after γ2subunit hybridizations in the posterior paraventricular nucleus of parturient (PA), day 7 (L7), and day 14 (L14) lactating rats (n = 5). Median ± SEM values are given in parentheses for each group.B, Cellular silver-grain analysis after γ2 subunit mRNA hybridization in the anteroventromedial (PVN oxytocin region) and posterodorsolateral (PVN vasopressin region) parts of the posterior paraventricular nucleus in parturient (PA), day 7 (L7), and day 14 (L14) lactating rats. Bars represent mean number of silver grains per cell ± SEM. **p < 0.01 as compared withL7.

