
Fig. 5.
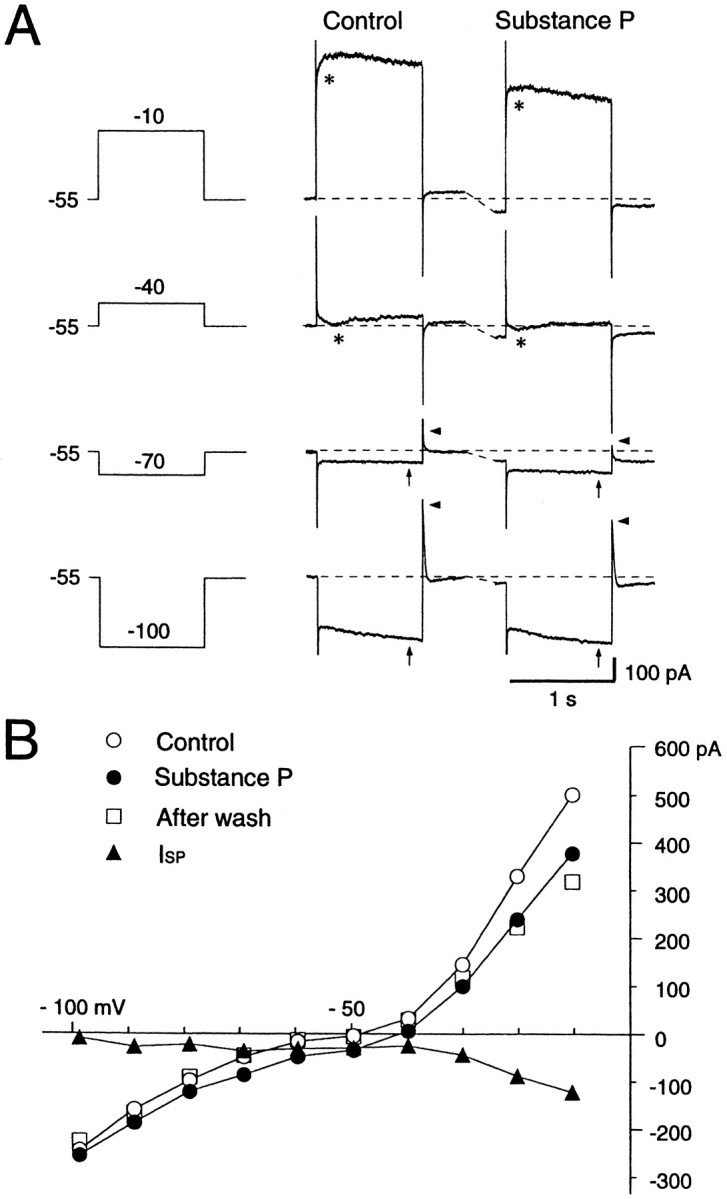
Effects of SP on a voltage-clamped large aspiny neuron bathed in normal saline containing TTX (0.3 μm). A, Current responses to step pulses (−100, −70, −40, and −10 mV) before (Control) and during the SP application. A prominent sag (arrows) at the hyperpolarizing pulse of −100 mV and a fast outward transient (arrowheads) on cessation of hyperpolarization are present. Depolarizing step pulses more positive than −40 mV evoked an inward current (asterisks). SP evoked an inward shift of the holding current. B, Steady-stateI–V curves before (○), during exposure to (•), and after washout (□) of SP. The curves were constructed from the measurements of current level attained at the end of each 1 sec hyperpolarizing or depolarizing voltage step before, during, and after SP application. The I–V curve forISP was obtained by subtraction of the control from the SP values (▴). Slope conductance decreased in the suprathreshold region, increased at resting membrane potential levels, and decreased again at potentials more negative than −70 mV during SP application.