Fig. 3.
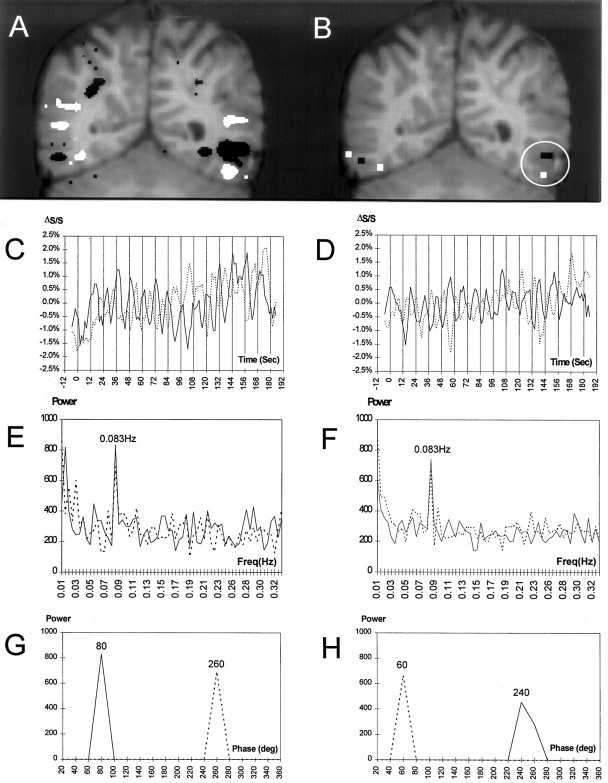
Activation in a subject (slice 4) in experiment 1. A, Activated voxels identified by split-t test for faces (white) and letterstrings (black) are shown superimposed on a T1-weighted coronal anatomical image. In this and subsequent figures, the right side of the brain is represented on the left side of the image. In the left hemisphere, a region at the border of the temporal and occipital lobes (white circle) was activated by faces in the fusiform gyrus and by letterstrings in the occipitotemporal sulcus. B, Activated voxels for faces (white) and letterstrings (black) identified by the frequency analysis are superimposed on the anatomical image. C, Time course of signal change for the voxels activated by faces (whitevoxels in circle) from B for both task orders. Percent signal change (ΔS/S) is shown on the y-axis. Vertical bars indicate onsets of the 14 successive stimulus cycles. The F–L and L–F conditions are represented by the solid and dotted lines, respectively. D, Time course of signal change for the voxels activated by letterstrings (blackvoxels in circle) from B for both task orders. E, Power spectra corresponding to the activation time course shown in C. Note the peak at the stimulus alternation frequency (0.083 Hz). Power (in arbitrary units) is shown on the y-axis. F, Power spectra corresponding toD. G, Power at the stimulus alternation frequency as a function of phase (in bins of 20°) for the activation time course shown in C. Note that the change in stimulus order produces a phase shift of 180°. H, Power at the stimulus alternation frequency as a function of phase for the activation time course shown in D.

