
Fig. 5.
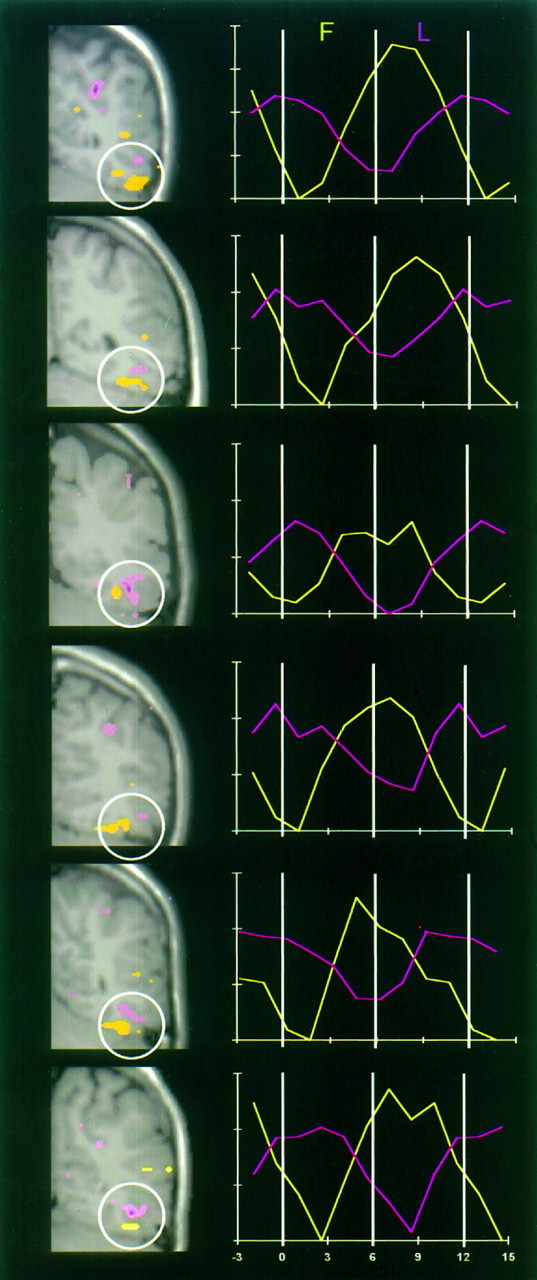
Activation data from the ventral left hemisphere (white circle) in six subjects. In the leftcolumn, activated voxels identified by split-t test analysis of the F–L condition are superimposed on corresponding anatomical images. Faces activated a region of the lateral fusiform gyrus (yellow), whereas letterstrings activated a region of the occipitotemporal sulcus (pink). The rightcolumn shows the corresponding activation time course averaged over all alternation cycles for faces (yellow lines) and letterstrings (pink lines). They-axis shows percent signal change with vertical ticks of 0.5%. Time (in sec) is shown on the x-axis.