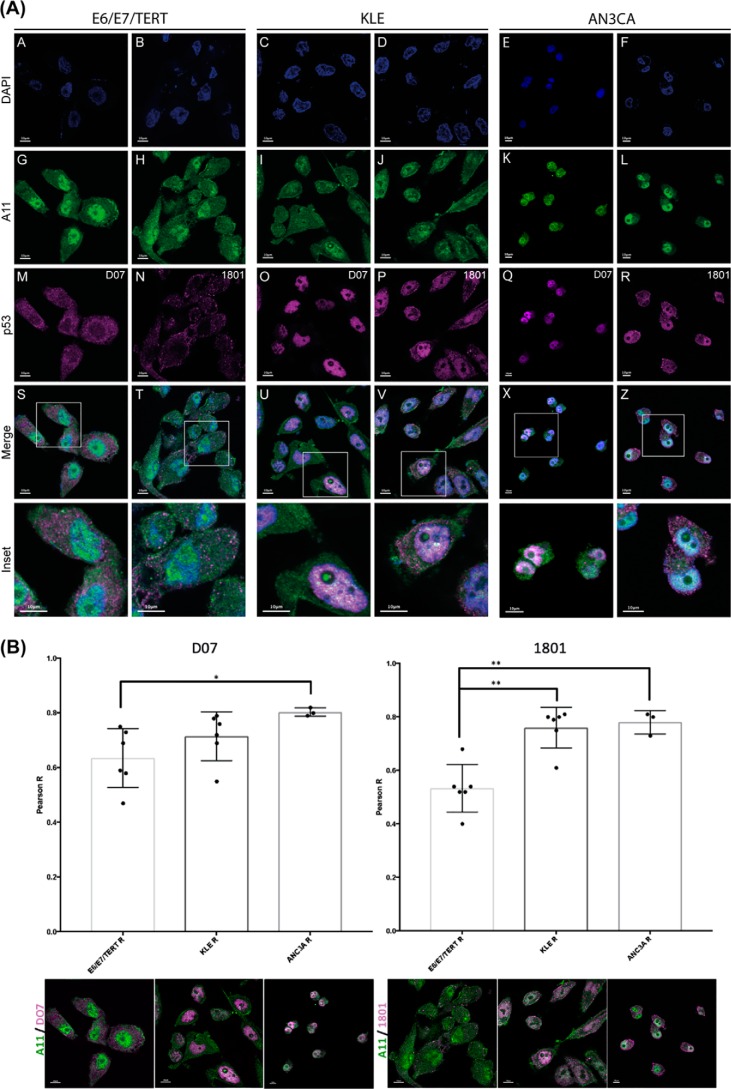
Figure 3.
The Δ40p53 isoform is a major component of cytoplasmic amyloid aggregates in EC cell lines. A, immunofluorescence analysis of E6/E7/TERT (an endometrial nontumor cell line) and KLE and AN3CA (endometrial tumor cell lines) stained with A11, DO-7, and 1801 anti-p53 primary antibodies and secondary goat anti-mouse IgG/Alexa 546 and goat anti-mouse IgG/Alexa 488 antibodies. The A11 anti-amyloid oligomer antibody (green) was used to detect amyloid oligomer aggregates, and DO-7 and 1801 anti-p53 antibodies were used to detect, respectively, fl-p53 and Δ40p53 (magenta) isoforms. Cells were counterstained with DAPI to identify nuclei (blue). Scale bars = 10 μm. B, quantification of co-localization between A11 and anti-p53 antibodies. Quantification of co-localization between A11 (green) and DO-7 (magenta) or A11 (green) and 1801 (magenta) antibodies in the E6/E7/TERT, KLE, and ANC3A cell lines is shown, respectively, on the left and right. Dots represent one quantified image with at least 5–10 cells (n > 15 cells for all studied conditions). The images in B are the same images as in A but without the nuclei (DAPI staining). The immunofluorescence images from which the quantification was performed are shown below each bar. Scale bars = 10 μm. Statistical significance was set as *, p < 0.05 and **, p < 0.005 using nonparametric Kruskal–Wallis and Dunn tests. Images were visualized using a confocal microscope (FV10i-O, Olympus).

