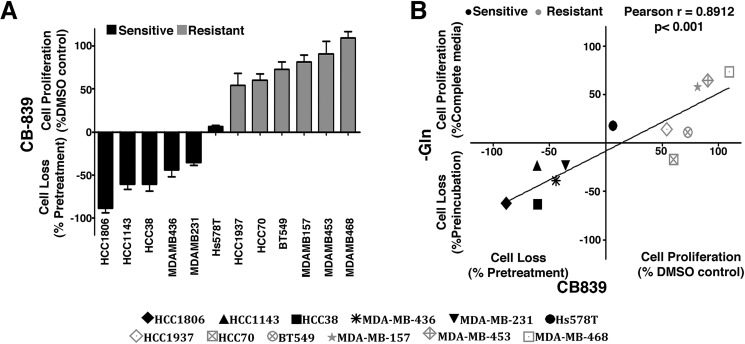
Figure 1.
TNBC cell lines respond differently to glutaminase inhibition. A, growth response of 12 TNBC cell lines treated with 1 μm CB-839 for 4 days. The cell lines were classified as resistant when treatment affected growth in less than 50% (compared with the DMSO control) and sensitive when treatment affected growth in more than 50% (compared with the DMSO control) or led to cell death (when the number of cells at the end point was smaller than the number of seeded cells). B, correlation between the growth response after 4 days of CB-839 treatment or incubation of TNBC cells in glutamine-free medium. Data represent the mean ± S.D. of n = 4.

