Figure 2.
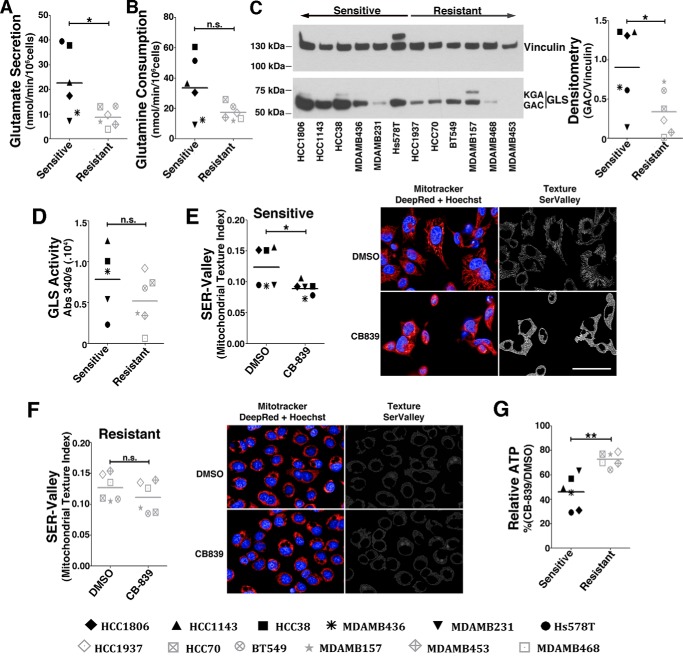
Resistant cell lines are less glutaminolytic and use an alternative energy source. A and B, glutamate secretion (A) and glutamine consumption (B) of sensitive and resistant cell lines. C, Western blot displaying GLS (GAC and kidney-type glutaminase (KGA) bands are indicated) protein levels. Shown is densitometry of GAC to vinculin band intensity ratio. D, GLS activity of the whole-cell lysate of sensitive and resistant cell lines (the HCC1806 cell line was not evaluated). E and F, SER Valley texture classification (1 pixel) from SER Features of MitoTracker Deep Red–labeled mitochondria of sensitive (E) and resistant cell lines (F) treated with CB-839 (or DMSO control). Shown are representative images of the sensitive HCC1806 (E) or resistant MDA-MB-468 cells (F). Scale bar = 50 μm. Hoechst staining was performed for nucleus detection (blue). G, relative ATP levels in CB-839–treated cells represented as a percentage of vehicle treatment (DMSO). In the boxplots in A, B, and D–G, each point represents the mean of n = 4 of each cell line. Student's t test was applied. *, p < 0.05; **, p < 0.01; n.s., nonsignificant.

