Figure 3.
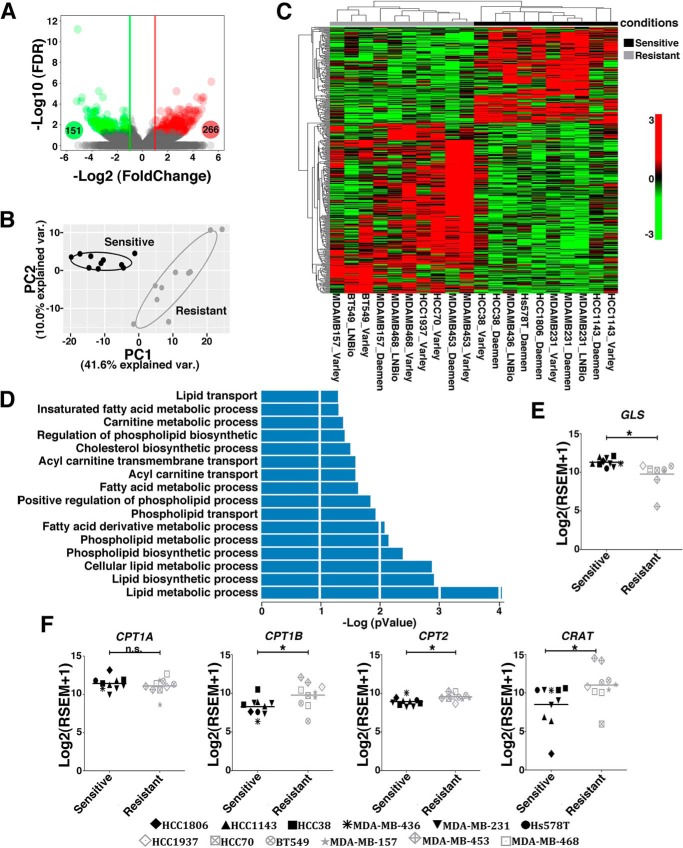
Resistant and sensitive TNBC cell lines present gene expression alterations in lipid metabolism pathways. A, volcano plot showing DE (green circles, down-regulated, Log2FC ≤ −1; red circles, up-regulated, log2FC ≥ +1; false discovery rate ≤ 0.05) genes between resistant and sensitive cell lines. B and C, unsupervised principal component analysis (B) and heatmap clustering (C) performed with DE genes revealed a clear separation between resistant and sensitive cell lines. D, biological processes related to lipid metabolism obtained from the pathway enrichment analysis (p ≤ 0.05). E and F, boxplots presenting differences in the expression levels of GLS (E) and CPT1A, CPT1B, CRAT, and CPT2 (F) between sensitive and resistant cell lines. Twenty samples were used in this analysis, with some of the cell lines presented as replicates (obtained from our laboratory or from data banks (38). We evaluated the resistant cell lines MDA-MB-453 (2 samples), HCC1937 (1 sample), MDA-MB-468 (2 samples), HCC70 (1 sample), MDA-MB-157 (2 samples), and BT549 (2 samples) and the sensitive cell lines HCC1143 (2 samples), HCC38 (2 samples), MDA-MB-436 (1 sample), MDA-MB-231 (3 samples), Hs578 (1 sample), and HCC1806 (1 sample). Student's t test was applied. *, p < 0.05; n.s., nonsignificant.

