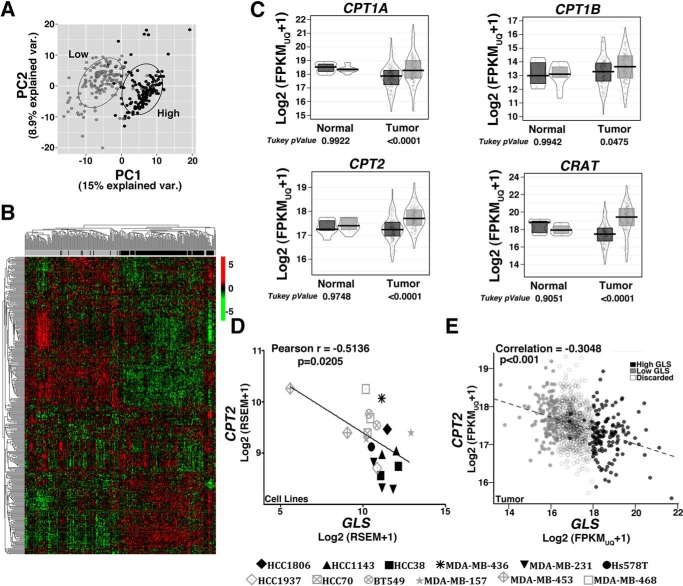
Figure 4.
Low and high GLS breast tumors present altered expression of lipid metabolism-related genes. A and B, unsupervised principal component analysis (A) and heatmap clustering (B) performed with the 337 genes related to “fatty acid metabolism process” (GO 0006631) show a separation between breast tumors classified as low or high GLS levels. C, boxplot presenting differences in the expression levels of CPT1A/B, CRAT, and CPT2 between low and high GLS levels in normal tissue and in breast tumors. D and E, correlation between CPT2 and GLS expression levels in cell lines (D) and breast tumors (E). In C, an ANOVA and Tukey's multiple comparisons were applied. In D, 20 samples were used for analysis, with some of the cell lines presented as replicates (obtained from our laboratory or data banks, (38). We evaluated the resistant cell lines MDA-MB-453 (2 samples), HCC1937 (1 sample), MDA-MB-468 (2 samples), HCC70 (1 sample), MDA-MB-157 (2 samples), and BT549 (2 samples) and the sensitive cell lines HCC1143 (2 samples), HCC38 (2 samples), MDA-MB-436 (1 sample), MDA-MB-231 (3 samples), Hs578 (1 sample), and HCC1806 (1 sample). In E, 1097 samples were used. Light gray, low-GLS samples; black, high-GLS samples.

