Figure 5.
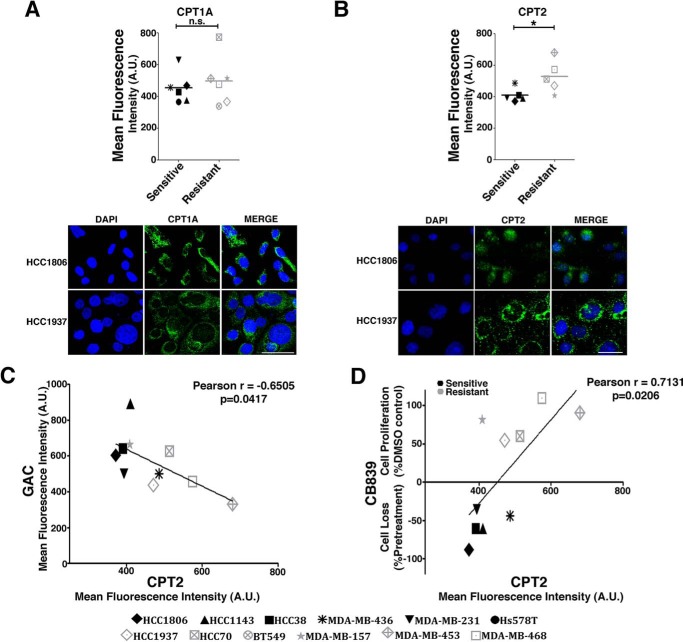
CPT2 levels are negatively correlated with GAC and CB-839 resistance. A and B, CPT1A (A) and CPT2 (B) protein levels as quantified by immunofluorescence of sensitive and resistant cell lines. Representative images of the sensitive HCC1806 cell line and the resistant HCC1937 cell line are shown below. Scale bars = 50 μm. DAPI staining was used for nucleus detection. C and D, Pearson correlation coefficient between the CPT2 and GAC immunofluorescent signal (C) and CB-839 effect on growth and the CPT2 immunofluorescent signal (D). In B–D, 10 cell lines were evaluated (Hs578T and BT549 cell lines were not evaluated). In A and B, Student's t test was applied. *, p < 0.05; n.s., nonsignificant; A.U., arbitrary units.

