Figure 6.
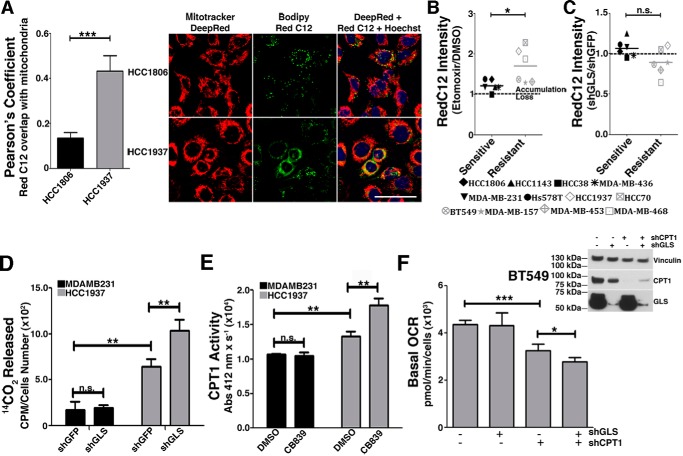
Resistant TNBC cell lines have increased mitochondrial β-oxidation, which is further increased by GLS attenuation. A, Pearson correlation coefficient between BODIPY 558/568 C12 (RedC12) and MitoTracker Deep Red in the sensitive HCC1806 cell line and the resistant HCC1937 cell line. Representative images of the cell lines are shown on the right. Hoechst staining was performed for nucleus detection. Higher correlation implies increased co-localization between the FA probe and mitochondria. Scale bar = 50 μm. B, BODIPY accumulation caused by etomoxir treatment in sensitive and resistant cells lines. C, four (BT549, MDA-MB-157, MDA-MB-453, and MDA-MB-468) of the six resistant cell lines and two (HCC38 and MDA-MB-436) of the six sensitive cell lines responded to GLS knockdown by decreasing the RedC12 fluorescent signal compared with the shGFP control, implying increased β-oxidation in these cells when GLS is attenuated. D, β-oxidation was directly measured by quantifying 14CO2 released from uniformly labeled [14C]palmitic acid. The resistant HCC1937 cell line released more 14CO2 than the sensitive cell line MDA-MB-231, which was further increased by GLS knockdown only in the resistant cell line. E, CPT1 activity was higher in the resistant HCC1937 cell line compared with the sensitive cell line MDA-MB-231, which was further increased by GLS knockdown only in the resistant cell line. F, the Western blot on the right shows GLS and CPT1A knockdown efficiency. Shown on the left is the basal OCR of the resistant BT549 cell line after individual or combined knockdown of GLS and CPT1A. In B and C, each point represents the mean of n = 4 of each cell line. In D--F, each bar represents the mean ± S.D. of n = 3. Student's t test was applied. *, p < 0.05; **, p < 0.01; ***, p < 0.001; n.s., nonsignificant.

