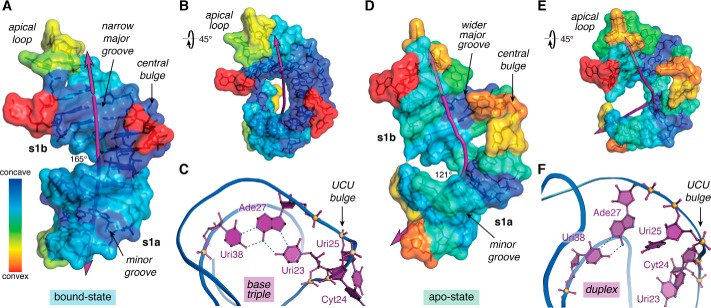
Figure 2.
Overview of TAR conformational differences in the ligand-bound and ligand-free states. A, surface map of concave and convex features for the bound-state of HIV-2 TAR (PDB entry 6mce) (76). The helical axis (purple line) deviates subtly from linearity with an angle of 165°. B, view of A rotated +45°; convex features map mainly to the apical loop and bulge. C, ribbon model passing through the phosphate backbone showing the Uri23·Ade27–Uri38 major-groove base triple—a hallmark long-range interaction characteristic of the ligand-bound state. The flanking UCU bulge is depicted. Coordinates were derived from the HIV-1 TAR–TBP6.7 complex (PDB entry 6cmn) (77). D, surface map of concave and convex features for apo-state HIV-1 TAR (PDB entry 1anr) (80). The helical axis bends substantially with an overall angle of 121°. The structure is characterized by more convex surfaces compared with the bound state. E, view of D rotated +45° to emphasize the helical bend. F, ribbon model revealing the Ade27–Uri38 duplex but not the major groove triple. Bases of the flanking UCU bulge penetrate the core contributing to the bend. The helical axis, angle, major-groove width, and depth were calculated by Curves+ (152); when applicable, parameters were computed as the average of the NMR ensemble. Concave and convex properties for each nucleotide of the lowest-energy NMR structures were calculated by Cx (83) and displayed on a Curves+ output file as a heat-map surface using PyMOL (Schrödinger, LLC). Here and elsewhere, perceived hydrogen bonds and related interactions are depicted as broken lines.

